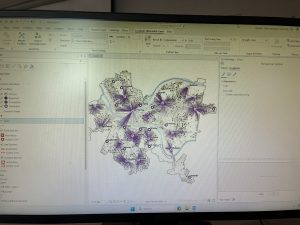
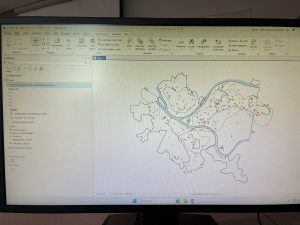
This week I basically just downloaded all the data needed for my final project. I explored the Delaware County, Ohio GIS Data Hub and looked through the datasets available in the “All Files” section. I downloaded Parcel, Street Centerline, Hydrology, and Township Boundary shapefiles. I also extracted them and exported them to ArcGIS. In terms of what they each do: Parcel outlines property boundaries across the county, Street Centerline layer displays the county’s road system, and Hydrology layer identifies streams and other water features. For my final project I also had to download the subdivision shapefile because I decided to do”Mapping Change” as well as “Making New Shape Files from Existing Shape Files”.
Cherry Week 7
Zip code:Contains all the Zip codes in Delaware County, Ohio. It was made by using data from the Census Bureau and the US Postal Service from 2000 and was created in 2005. It is not regularly updated but is updated on a when-needed basis, using the US Postal Service, which is updated monthly.
School District: This holds data that pertains to all schools within Delaware County, and is updated on a as needed basis, and issues the data from Delaware County Auditor’s parcel records to create it.
2021 Imagery: Imagery that was captured in 2022 and last updated then as well.
2022 Leaf-on Imagery: Imagery created in 2022 that has a different resolution of 12in
2024 Aerial imagery: data that was obtained during the spring of 2024 and contains 3in an aerial view.
Address Point: Locates the individual building location as accurately as possible while using data from The State of Ohio Location Based Response System and through a partnership between The State of Ohio and Delaware County.
Annexation: This contains information about conforming boundaries and annexations from and that date all the way back to 1853.
Building Outlines DXF + Building Outline 2021 + Building Outline 2023:The DXF uses CAD drawings and was last updated in 2020, while 2021 and 2023 are new updates. The building outlines that were updated in two years after their respective names,while being service features files.
Condo: This data consists of condominium polygons that assess and give a view to the individual units within a condo. This uses data from the Delaware County Records Office and was last updated a few days ago 2/27/2026
Dedicated ROW: Shows all Roads within Delaware County that consist of Right-of-ways, It is updated on a daily basis and published updates once a month and it was published in 2020
Delaware County Contours:A geodatabase file last updated in 2021 that shows the ‘contours’ of delaware county that is basically showing the terrain, the elevation etc.
Delaware county E911 Data:Uses data and address points to locate the centroids of buildings, which is important for emergency services. It was also published in 2021 but is also updated daily and published on a monthly basis.
Farm lot:This was built with the intention of showing military farmlots in Delaware County. It is updated on an as needed basis whenever new surveys are done on these areas. It was 2020 and was last updated in February of this year.
GPS +Delaware County GIS Data Extract Web Map:Identifies monuments from 1991 – 97 and is updated on an as needed basis. Also hasn’t been updated since 2021.
The extract web map of Delaware County in GIS that is able to be extracted into a variety of formats.
Hydrology: This data set shows the major ‘water ways’ within the Delaware County Region, also updated on an as needed basis.
Fall Background: A background for fall that was created in 2019 and last updated then as well.
MSAG:A master street address guide that depicts the different political jurisdictions.
Map Sheet: All map sheets within Delaware county. Created in 2020 but most recently updated in February.
Municipality:Pretty self-explanatory it is basically data that consists of all the municipalities within Delaware County. Created in 2020 and last updated in February as well.
Original Township + Township: The original township lines of Delaware County before tax districts changed these lines. Township consists of the 19 different townships that makeup the entirety of Delaware county.
Parcel:Parcels are polygons that represent all cadastral parcels which are
Precincts: Shows the division between the voting precincts in Delaware County.
Railroads: Shows a view of all railroads within the Delaware County lines.
Recorded Document:A sum of miscellaneous recorded documents in relation to Delaware county. It is updated on a weekly basis.
Street Centerline + DXF Centerlines:This uses LBRS to depict pavement centers of public and private roads with intentions to support appraisal mapping and emergency response services. DXF Uses field surveys
Subdivision: This data contains information in regards to all recorded subdivisions and condos in Delaware county.
Survey:These are survey points that represent shapefiles of surveys of the land. Old volumes are not currently included in this.
Tax District:Includes all and separates the tax differences within Delaware County. It was published in 2020 and recently updated last month on an as needed basis
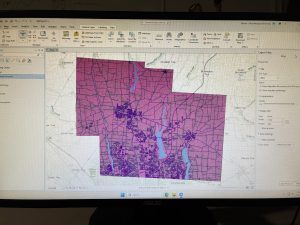
Butte_Week 5
Chapter 4:
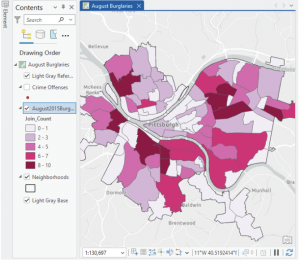
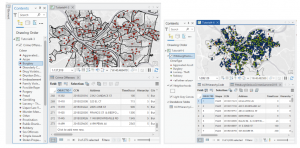
Chapter 4 gets into the databases/ Geodatabases. A very helpful thing to understand when working within ArcGIS- they are the central storage bank for all information/ data that pertains to a certain organization or project. File geodatabases have no limits to the size or amount of feature classes or raster datasets could be stored in it, and it keeps all your project information in one easy to access place! Over the course of the next few chapters, I used the geodatabase for each chapter to select any files I needed, quickly. It’s good to learn how to convert external files into the proper format for the file geodatabase, so you know how to work on a map from an external source. This is primarily because when working on a project from scratch, a lot of the data needed might not be available from the Esri/ ArcGIS collections, and would prompt the need for an outside source (like a census bureau tract for example). There was a bit of bookkeeping this chapter, with moving files around and developing understanding of these databases. One thing I learned that I found very helpful was that if you delete something from the contents pane, it is still filed in the geodatabase and can be brought back to the map. While on the other hand, if something is deleted straight from the database, that is permanent. As someone who is very nervous when deleting anything on a project, understanding how the files work within their environment and where backups are is good knowledge to have! I also liked that the system won’t let you accidentally delete any important keys from the field table. This is very reassuring as working with the tables can get somewhat confusing, and I’m always worried I’ll hit a button and accidentally erase a needed field. It was also interesting to learn that GEOID and GEOIDNumber are technically the same data, but two different ways that the field can be categorized. While they are the same kind of attribute, they cannot be joined together due to their different codes (GEOIDNum- 4048 vs GEOID- 04870). Diving deeper into the Python language and SQL helps me develop a stronger understanding of what I am doing when adjusting the code on my map. Like understanding that using ‘OR’ within a data query is essentially saying and/ adding the two fields instead of using one or the other like it sounds- and using ‘AND’ means the opposite, picking one or the other. Using the SQL and Definition Query to plot out exact pockets of dates and times to find the specific data you’re looking for is especially important when you need a small time pocket of data from a larger scaled data set.
Chapter 5:
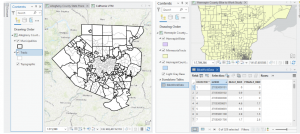
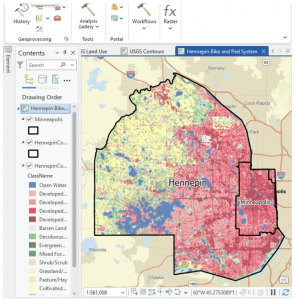
This chapter felt like we were learning how to read a map the “old-school” way, developing skills on reading and understanding the longitude and latitude, and positioning of locations. I appreciated that it explained map proportions and showed that most of the maps we’re taught about in school are technically all distorted/ inaccurate. I learned a new word that I actually quite like: Graticule. In regards to the longitude and latitude, a graticule is the coordinate point system. Chapter 5 gets back into the local versus world aspect of maps, detailing that certain maps work better on a smaller vs. a larger scale. For example, using localized projected coordinates for a smaller map such as Minneapolis or Hennepin works best due to its specialized data that focuses specifically on that region. This chapter also talked more about the file types, with specifics on shapefiles and the continued use of the geodatabase. I also learned how to access other websites to download their maps/ data- like the ArcGIS Living Atlas and dealing with the US Census Bureau again. At the end, I had a few issues when working on the joint data/ choropleth map section. The copied fields had been showing no data, and although I went back and repeated the steps from the start, the fields continued to not provide any data needed to even change the symbology into the graduated scale.
Chapter 6:
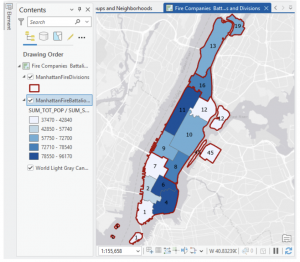
I love how this chapter began with more examples of real-world applications with the GISystem. That it did not abandon the initial idea that Geospatial Analysis tools can be used for many more reasons than people would first assume. On tools, the chapter explores a lot more, various geoprocessing tools. Because there are so many tools within the GIS system, it’s very helpful that the tutorial runs through as much of them as possible. Giving more examples and definitions, and having us actively use and have our own “turn” at using the tools. Intersecting features was surprisingly simple, and although the chapter has a lot of assignments, they were all short and sweet. That being said, I believe I learn better from the longer tutorial assignments, where if something is done wrong at a certain stage, then any work that connects to that could be off as well. It raises the stakes, and makes me pay close attention to what the tutorial says, and what I’m doing in my project. Setting a Study Area was one tutorial that I found particularly useful. When working in a location (like New York City) that has an overwhelming amount of streets and attributes, blocking off a specific work area quiets the noise and makes everything easier to work through. On the topic of simplifying everything, putting all classes into one single feature class really keeps things decluttered and simple- definitely something I will take advantage of in the future. This chapter really showed how many different ways there are to combine features, maps and tables (like the Union tool, or Intersect tool).
whitfield Week 7 (pt. 2)
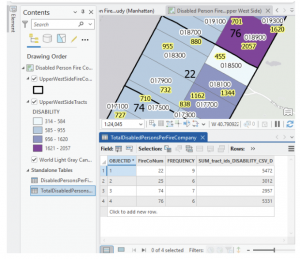
I completely forgot to include this in my first week 7 post, so I made a part 2:
Gregory Week 7
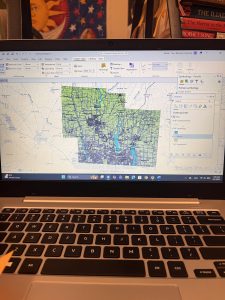
This week, I downloaded the available GIS data layers for Delaware County, Ohio. The three specific datasets I worked with were Parcel, Street Centerline, and Hydrology. Each of these layers provides different information that is useful for understanding how certain things are laid out across an area (Delaware). The Parcel data layer consists of polygon features that represent all cadastral parcel boundaries within Delaware County. The term “cadastral parcel” was something that I was unfamiliar with – it means a piece of land that contains fixed boundaries and is recorded in official land records. Upon further examination of the Delaware County Ohio GIS Data Hub, I discovered that his dataset is maintained by the Delaware County Auditor’s GIS Office and is based on officially recorded documents from the Recorder’s Office.
The first layer I downloaded was the parcel layer. This layer is updated daily and is commonly used for property assessment and boundary mapping. Specifically, the layer provides an accurate representation of how land is divided throughout the county. The next layer downloaded was the Street Centerline data and it shows the centerlines of both public and private roads in Delaware County. This data is spatially accurate and is updated frequently to reflect changes in road infrastructure and addressing. Finally, the Hydrology data layer is a representation of major waterways within Delaware County, including rivers and streams. The hydrology layer is useful for understanding drainage patterns, as well as the relationship between land use/water resources. After downloading the Parcel, Street Centerline, and Hydrology datasets as shapefiles, I created a new ArcGIS Pro project and added all three layers to the map. Displaying these layers together allows for a better understanding of how parcels, roads, and waterways interact spatially across the county. This was a pretty easy map to create, and I got to choose my own colors for the symbols which was enjoyable.
Bulger Week 7
Tax District
This data set contains tax districts in Delaware, OH. It is from the Auditor’s Real Estate Office. It is updated as needed.
Parcel
This data set contains the cadastral parcel lines in Delaware, OH. It is maintained by the Auditor’s GIS Office. Records are in the County Recorder’s Office, and individual records are in the CAMA system. It is updated daily.
Address Point
This data set is a representation of certified addresses in Delaware, OH. It is maintained by the Auditor’s GIS Office. The Address_Points layer is for appraisal mapping, 911, accident reporting, geocoding, and disaster management. It is updated daily.
Recorded Document
This data set consists of points that represent documents in the Recorder’s Plat Books, Cabinet/Sides, and Instruments Records. These documents include vacations, subdivisions, centerline surveys, annexations, and other documents. It is updated weekly.
Zip Code
This data set contains zip codes in Delaware, OH, and was created in 2005. Some places were either tax-exempt or had no zip codes, so they were manually populated. The layer was created from data from the Census Bureau, USPS, and tax mailing addresses from the treasurer. It is updated as needed.
School District
This data set contains the school districts in Delaware, OH. It is created from the County Auditor’s records. It is updated as needed.
Map Sheet
This data set contains the map sheets in Delaware, OH.
PLSS
This data set contains all the Public Land Survey System data in the US Military and Virginia Military Survey Districts of Delaware, OH. It is updated as needed.
MSAG
MSAG stands for Master Street Address Guide. This data set contains the 28 political jurisdictions in Delaware, OH. It was created for locating boundaries of cities, villages, and townships in the county. It is updated as needed.
Municipality
This data set contains the municipalities of Delaware, OH.
Farm Lot
This data set contains the farmlots in the US Military and Virginia Military Survey Districts of Delaware, OH. It is used to identify the farmlots and their boundaries. It is updated as needed.
Township
This data set contains the geographic boundaries of the 19 townships in Delaware, OH.
Street Centerline
This data set depicts center pavement on all roads in Delaware, OH. It was collected by field observation. It is used for appraisal mapping, 911, accident reporting, geocoding, disaster management, and roadway inventory. It is updated daily and the 3-D fields are updated annually.
Annexation
This data set contains annexations and conforming boundaries in Delaware, OH from 1853 to present day. It is updated as needed.
Condo
This data set contains the condominium polygons in Delaware, OH. The data is from the County Recorder’s Office.
Subdivision
This data set contains the subdivisions and condos in Delaware, OH. The data is from the County Recorder’s Office. It is updated daily.
Survey
This data set contains a shapefile of points that represent surveys of land in Delaware, OH. The data is from the Recorder’s office and the Map Department. Old Survey Volumes are not included. Some surveys are still being scanned. It is updated daily.
Dedicated ROW
This data set consists of right-of-way roads in Delaware, OH. It is updated as needed based on parcel data. All changes are recorded in the County Recorder’s Office and updated daily.
Building Outline 2024
This data set contains the outlines of all buildings in Delaware County. It was last updated in 2024 and is updated as needed.
Building Outline 2023
This data set contains the outlines of all buildings in Delaware County. It was last updated in 2023 and is updated as needed.
Railroads
This data set contains the railroad lines in Delaware, OH. It was digitized by the County Auditor’s GIS Office from ortho photography corrected from 1997 to 2002 and 2006.
Precincts
This data set consists of voting precincts in Delaware, OH. It is maintained by the County Auditor’s GIS Office. It is updated as needed.
Delaware County E911 Data
This data set contains an accurate representation of certified addresses in Delaware, OH. It is used for appraisal mapping, 911, accident reporting, geocoding, and disaster management. It is updated daily.
Building Outline 2021
This data set contains the outlines of all buildings in Delaware, OH. It was last updated in 2021 and is updated as needed.
Hydrology
This data set consists of major waterways in Delaware, OH. It was enhanced with LIDAR data in 2018. It is updated as needed.
GPS
This data set has GPS monuments established in 1991 and 1997 in Delaware, OH. The coordinates are in Universal Transverse Mercator Northing and Easting. It is updated as needed.
Delaware County Contours
This data set contains two foot contours from 2018.
Original Township
This data set contains the original boundaries of townships before tax district changes in Delaware, OH.
Pichardo – Week 7
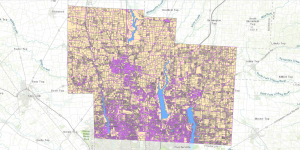
This week I explored the Delaware County Ohio GIS Data Hub and reviewed the available datasets under the “All Files” section. After reading through the data summaries, I downloaded the Parcel, Street Centerline, Hydrology, and Township Boundary shapefiles. I extracted the files and added them into ArcGIS Pro so I could look through the attribute tables and better understand what information is attached to each layer.
The Parcel layer is the most detailed dataset. It includes property boundaries across Delaware County and contains a large amount of attribute information, such as parcel identification numbers, ownership details, and land use classifications listed in the “class” field. This dataset will be especially useful for spatial selection and land-based analysis.
The Street Centerline layer shows the county’s road network, including road names and classifications. This will help provide reference on maps and will also be useful for buffering and proximity analysis.
The Hydrology layer includes streams and other water features throughout the county, which will support environmental and spatial relationship analysis. The Township Boundary layer defines township limits and will allow me to focus analysis within a specific administrative area.
For my final project, I plan to focus on Concept 3 (“What’s Inside?”) and Concept 4 (“What’s Nearby?”). These concepts will allow me to examine how parcels relate to township boundaries and water features, as well as analyze proximity to roads and streams using buffers. Overall, these datasets provide a strong foundation for meaningful spatial analysis in Delaware County.
Mason week 7
Zip Code: This dataset contains all existing zip codes, covering different outlines of land, for Delaware county. It references a collection of data found on Census Bureau, the United States Postal Service, and tax mailing addresses.
School Districts: A visual compellation of different school districts throughout Delaware county. Information on this dataset is updated regularly, sourced from Delaware County Auditor’s parcel records.
Building Outlines 2023: This is a dataset that contains blocked out outlines for each building located within Delaware County up to the year 2023.
Building Outlines 2021: This dataset contains blocked out outlines for buildings existing within Delaware county in the year 2021.
PLSS: This dataset visually displays the Public Land Survey System, with the polygons representing data from the U.S military and Virginia military survey districts. The creation of this dataset aided in identifying the boundaries of the prior mentioned survey land. The data is updated when needed.
Township: The data includes 19 townships that reside within Delaware county. In order to keep the information up to date, the data is updated when needed.
2024 Aerial imagery: imagery captured in 2024 of Delaware county.
Delaware County E911 Data: This dataset represents the different location based response system locations in place within Delaware county. Each address data-point is a different emergency response location. The information provided is intended to aid emergency responders in the closest response site from particular surrounding addresses. This information is updated daily.
Original Township: A dataset that displays the state of Delaware’s townships before tax districts changed their shape.
2021 Imagery (SID file): Imagery captured in Delaware County in 2021.
Recorded Document: This is a dataset that is composed of points that indicate locations with recorded documents such as Plat’s books, slides, and instrument records. The records themselves consist of various surveys regarding different features within Delaware. The purpose of this dataset is to aid in the locating of different types of documents.
Dedicated Row: The features that this dataset represents are the different lines that are designated the right of way within Delaware County. This information was created through daily updates. The changes made are sourced from Delaware county’s recorder office.
Precincts: The data from this set is in relation to differentiated voting precincts. The information is regulated by the Delaware county board of education. It is updated on a regular basis to keep the information up to date.
Delaware County Contours: A datafile of the different elevation contours of the landscape of Delaware county as of 2018. The data is in Geodatabase format.
Building Outlines DXF: An outline of buildings residing within Delaware.
Street Centerlines DXF: Contains data that indicates the centerline of pavement in both public and private roads running through Delaware county. The dataset was created using building permit information.
Address Points DXF: This specific dataset includes information about location based addresses to increase accuracy. The information in this dataset was created by the state of Ohio and Delaware County, and is maintained using the Delaware County Auditors GIS office.
Parcel: The dataset contains polygon information that outlines the parcels within Delaware county. Any changes within the dataset are done in reference to recorded documents, and information is maintained by Auditors CAMA.
Street Centerline: Outlines are made that indicate the centerline of public and private roads within Delaware. The information is collected from field observations and existing addresses.
Condo: A dataset that contains polygons that indicate the location of existing condos within Delaware County. The polygons have been sourced from Delaware County’s recorders office.
Subdivision: This Data file contains a combination of both subdivisions and condominiums within Delaware County. The data is updated regularly in order to maintain accuracy.
Address Point: This data file contains geographically accurate addresses for Delaware County. The information is upheld by the Delaware County Auditor’s office. This data is intended to support emergency first responders as well as other services that require geographic understanding.
Map Sheet: This file contains all map sheets depicting Delaware County.
Farm Lot: The datafile displays existing farmlots within Delaware County. The data is in correlation to both U.S military and Virginia military survey zones. This dataset was created to clarify the borders of the county’s farmland and military districts.
Annexation: This file displays Delaware County’s annexations on a time frame from 1853 and up to present day. This data is updated when needed, particularly when annexations are recorded.
Survey: This dataset contains dot style data features that represent different surveys of land across Delaware County. The displayed information is sourced from the Recorder’s Office. All of the surveys residing in the Recorder’s Office since 2004 are collected by GIS scanners.
Tax District: This file displays all tax districts within Delaware. The information is described by Delaware County’s Auditor’s real-estate office. It is updated when needed.
2022 Leaf-On Industry: Imagery taken of Delaware county from 2022 in high resolution.
Hydrology: This dataset displays major waterways that exist within Delaware County. This information is updated when needed.
GPS: This information depicts all GPS monuments that had been recorded between the years 1991 and 1997. This data is updated when it is deemed necessary.
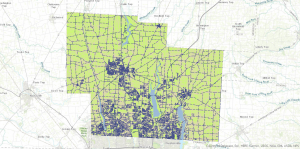
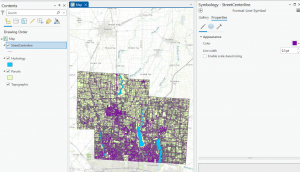
This section of the data was easy upon learning about the add Data section. I had even took the time to modify the colors of the map to my personal liking.
Whitfield Week 7
Address Point: A representation of all certified addresses that are in Delaware Ohio. Address points indicate the location of the building centroid and are indicated to support appraisal mapping, 911 emergency response, accident reporting, geocoding, and disaster management. It is also able to help 911 service agencies by giving information. It’s updated on a daily basis and published monthly.
Annexation: Delaware County’s annexations and conforming boundaries from 1853 to today. It’s updated on an as needed basis after an annexation has been recorded by that Delaware County Records office, published monthly.
Building Outline: outlines for all of the structures in Delaware County, Ohio. updated in 2024 and changes on an as-needed basis.
Condo: All of the condominium polygons that are within Delaware County, Ohio that have been reported to the Delaware County Records office.
Delaware County E911 Data: spatially accurate representation of all certified addresses that are within Delaware County Ohio, maintained by Delaware County Auditor’s GIS Office. Same information as the Address Point.
GPS: identifies all GPS monuments that were established in 1991 and 1997, it is updated on an as-needed basis and published monthly.
MSAG: Polygon feature set of the 28 different political jurisdictions like townships, cities, and villages that make up Delaware County. This dataset is updated on an as-needed basis and is published monthly.
Municipality: A data set containing all of the municipalities in Delaware County, Ohio
Parcel: A data set of polygons representing all of the cadastral parcel lines that are within Delaware County Ohio, maintained by the Delaware County Auditor’s GIS office. Changes are represented by recorded documents that are stored within the Delaware County Recorder’s office. This is maintained by the auditor’s CAMA and is maintained on a daily basis and is published monthly.
Precincts: A dataset that consists of voting Precincts in Delaware County, Ohio. It is maintained by the Delaware County Auditors GIS Office under the direction of the Delaware County Board of Elections, this dataset is updated on an as needed basis and is published by the Delaware Board of Elections.
Recorded Documents: Database showing points representing recorded documents in the Delaware County Recorder’s Plat books, cabinet/slides, and instrument records that aren’t represented by subdivision plats that are active. This was created to facilitate the process of locating miscellaneous documents that are within Delaware County, Ohio related to the cadastral land base. It is updated on a weekly basis, and published monthly.
School District: Dataset with all of the Schools Districts within Delaware County Ohio. It is updated on an as needed basis, and published monthly.
Street Centerline: pavement of public and private roads within Delaware County, A spatially accurate topologically correct representation of the road system. It is updated on a daily basis for all fields but the 3-D fields (updated on an annual basis).
Subdivision: A dataset that consists of all of the subdivisions and condos recorded in the Delaware County Recorder’s Office, Updated on a daily basis and published monthly.
Survey: surveys recorded in the Recorder’s office and all surveys that are municipal/village jurisdictions that are residing in the offices as of May 2024, they were and still are being scanned by the Map Department. The Dataset is updated on a daily basis and it is published monthly.
Tax District: data sets for all of the tax districts within Delaware County, Ohio. The data is defined by the Delaware County Auditor’s Real Estate Office and the Data is dissolved on the Tax District code, with the data being updated on an as needed basis, and published monthly.
Cherry Week 6 Blog Submission
Chapter 7
So far this chapter has been really interesting, and I quite enjoyed learning how to adjust the shapes around the buildings on the campus in several different ways, from just moving them to properly cover the building, to learning how to rotate and change the entire shape of them. Additionally, learning how to separate the shapes covering the buildings from one another, I think the split tool for me was the most confusing part of 7-1 because of how you had to click things in such specific spots.
There were a couple of hiccups for the 7-2 section for me, but ultimately, this part of the chapter just felt like I was moving around a bunch of shapes and changing them, so it was pretty fun. I was also glad to learn how to separate the shapes that were on the top of the building because I had tried to adjust some of them in the first section, and it hadn’t shown us how to do that till later on. I liked learning how to add the bus stops to this section, even though it was quite confusing, but it was interesting to add information like this to the map.
As for 7-3 and 7-4, they felt quite short in comparison to the other sections, but they were interesting. Again, most of this chapter wasn’t too complicated, and I got through it fairly quickly in comparison to the rest of the chapters we’ve done so far.
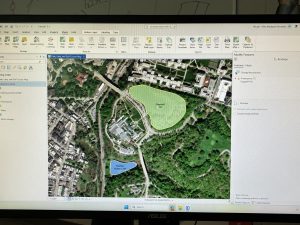
The smooth polygon feature was really easy to use, as are most of the features in geoprocessing, so this was interesting as well. 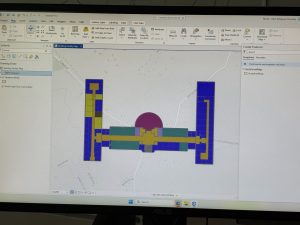
Rotating and moving a shape to connect it with another one was kind of confusing to do, but overall, not too bad.
Chapter 8
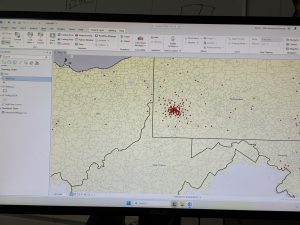
While working on the chapters, I’ve seen the create locator feature, but don’t remember using it at any point until now, so it was interesting to use that feature, considering a big component of the process is using zip codes to, I guess, ‘geocode’ the information onto the map. It was also interesting to see how, after doing this, there were a few records that didn’t match, but since they still had an address, it was still viable information.
This chapter felt quite a bit shorter than the rest of the chapters, and I did not really struggle with any of it or have any particular questions about this chapter specifically.
Chapter 9
Something I did really struggle with a few chapters ago was trying to use the select by attributes tool, but I have had to use it a couple of times in this chapter, and it has gotten quite a bit easier to understand how to do, and with practice, I understand how to do it now without struggling.
Working with the service area and location-allocation tools has been confusing. Both 9-3 and 9-4 are complicated due to the many details. As I continued to finish 9-4, those tools became a lot easier to use, so I don’t have any concerns or questions about them.
Another thing I really struggled with was trying to do the summary statistics for Hierarchy, ArrAge, and ArrGender. Since this was one of the your turn sections in the chapter and I wasn’t exactly sure what I was doing, it caused me a lot of confusion while i wass trying to work on it although I do think it was kind of fun to see the map throughout post of this seectiosn because I think the things being added in made them look really interesting.