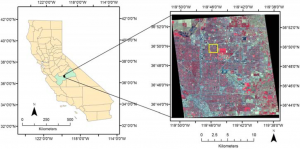
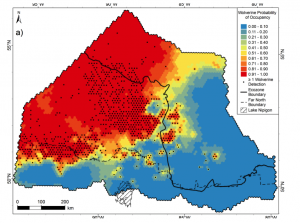
I completed the GEOG 291 Quiz.
Introduction:
My name is Charlie Holbrooks, and I’m a Junior from Perry, OH. I’m majoring in Creative Writing and Environmental Studies and minoring in dance, so I’m taking this course as required for my Environmental Studies major. I’m happy to be taking this course to add to my resume and better understand processes in conservation and populations. I am also an intern for the campus Upcycling Center in Haycock Hall, where we process donations of items that can’t quite be recycled or sold. If you are an art student or enjoy art, come use us as a free resource for your materials! I also participate in Orchesis and Terpsicorps dance companies, and am a member of Delta Gamma Fraternity (Sorority).
I’m also trying to revive our campus skating club this year, so PLEASE let me know if you’d be interested!
Ch.1 thoughts:
What I noted about this chapter was the frequent discussion of how global or geographical questions are typically also social questions. I find it really interesting how we can transpose data between two things as different as the most popular cereal brand in America and the number of people by area that consume it on a daily basis. I also loved learning about how our food systems are mapped out, and how that allows us to discover where our food comes from and the route it took to get to us. Another thing that I found interesting was its use for mapping roads, surface materials, weather, waterways, and public transportation. I love to roller skate everywhere, so I am constantly using services like Flattest Route to find the best route to my destination. Knowing that GIS is pertinent in my day-to-day life makes me very excited to learn more about it. I have a friend who is extremely passionate about third spaces and what they do for children specifically, and I would love to see how she could use GIS to map out the use and placement of third spaces within communities. This is a bit unrelated to the reading, but I would also love to see GIS used in mapping out where different colleges/high schools are, and the routes taken to ‘away’ sports games and the frequency of visitation between them. Within the reading, I also think it’s important for us to learn how government agencies use GIS to map out borders/boundaries, and how it’s used to monitor our daily lives.
Google Scholar findings:
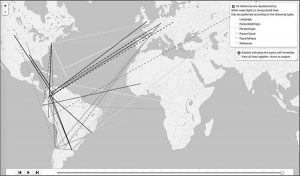
A quote I found within one of my sources sums up what I find most interesting about GIS: “Spatial historians have underscored the potential of tools like GIS for discovering the correlations and connections ‘among events in space and time for narrative generation.’” I searched for a use of GIS within the dance world, and found that GIS is frequently used to map the relationships between ballet tours from around the world. “Spatial history tends to depend on GIS-based understandings of space as a more absolute, pre-given Cartesian grid, which curtails local specificity and understandings of place. For example, looking through archival materials, there is a cultural precision to the granularity of place names like “Harlem” and “Fifth Avenue,” but this needs to be negotiated vis-à-vis the opportunity for a larger connection to New York City in general. In addition, there are professional agreements in the geodata community that have identified generic latitude/longitude coordinates for cities. But in the case of New York City, that point itself is fixed at Fifth Avenue. What about that exact location qualifies it to stand in for the whole? Likewise, most base maps can only represent a single period of time at once in terms of national borders, railways, major roads, and so on, and yet the very existence of some routes and not others in a given year will have determined a touring company’s pathway.” This section explains this use of GIS in such a fantastic and understandable way, and helps me to see exactly how GIS was used in this study. I find it interesting that they discuss the actual topography of a location vs points we fix/distinguish as important as humans. It makes me question: what is the more ‘natural’ solution? Is it more natural to follow the topography and natural borders of a location, or more natural to allow human instinct to select certain points or areas to go off of?
Figure showing routes between ballet schools by language/word vs physical travel