Grennell Week 3

Personal Summary

Chapter 4: 

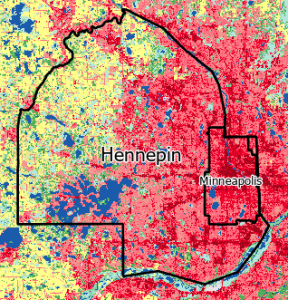
In chapter four, the topic of mapping density is covered.  For context, in GIS, density is equivalent to concentration. By mapping areas of both high and low concentrations, it allows you to recognize patterns. After covering the Why the chapter transitions into the what.  It stares that in order to map density, “you can shade defined areas based on a density value or create a density surface.  ( This confused me because it didnt explain what each of them were.  So I did a little reasearch because I was confused and found that a Density surface is absically a gradient over a wide range while a density value is a bullentin point in a small area that gives specified values). It also talks about using GIS to map both points and lines. ( points make sense to graph but lines not so much, I tried to figure out what it meant but it just confused me more).  The last thing mentioned in the topic of “deciding what to map” was the topic of features vs feature values, Which was easy to understand since they gave examples for this one.  Mapping  features would be like mapping the locations of buisnesses while feature values would be like taking the number of emplyees at each buisness. The chaprer then tells two ways to map density, The first is by mapping a defined area (which is I think using Density value because the images show plots of a small region) in this method you can use a dot map to calculate density for each value. The other method is by density surface (ok I think I was right)  which is when each layer gets its own density which makes a gradient type look agross the entire map.

Chapter 5: 

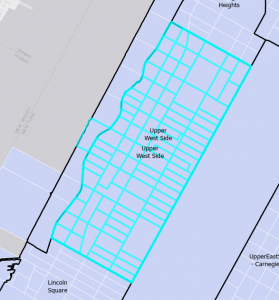
The title of this chapter is “finding whats inside” (im gonna take a guess just by the title it might mention how to interpret the density and make sense of it when making a hypothesis) . The chapter starts off by exlpaining the importance of mapping out the inside of an area. It states that “people map what’s inside an area to monitor what’s occuring inside it, or to compare several areas based on whats inside each”. ( I think this is a common thing thats done in most ENVS/BIO type labs at this school. I never realized that GIS was so commonly used and I never knew what it was until this year).  An example that the chapter used to express the importance of mapping was by  monitoring drug-related arrests within 1,000 feet if a school. In doing so they would give harsher punishments to said dealers. The chapter then goes into “definng your analysis” ( I assumed correctly) .  It mentions that you can draw an area boundry on top of the features to help summarize them (this made no sense to me at all, but It could be because I havent done any actual GIS work yet).  The chapter also states that in order to analyze your data you have to conside how many and the type of features it contains.  (which makes sense because how can you hypothesize something whithout knowing what exactly your looking at). After further reading I think im starting to understand the boundries, I assumed it was no different then any other boundry and it isnt but its there to seperate a specified area from things not considered “in range”.

Chapter 6: 

Chapter six is titled “finding whats nearby”,  but covers things like defining your analysis, three ways to find whats nearby.  (this doesnt really make sense to me considering the last chapter was talking about setting boundries in order to cust things off, but now it wants you to also map whats around)? The chapter starts by explaing the “Why”, turns out its important because lets say your going to like walmart but theres a target close. By having the target pinged on the map it lets you know that theres also a target you could go too. (or at least thats how i interpreted this section of the reading). The chpater also talks about a method used to find whats nearby, the method they mentioned was measuring using straght line distance (is this like literally a straght line from A to B) by doing this they can gain an idea of measuring “nearness”. Another meathod that they said is measuring distance or nearness by travel cost (this was in context to traveling only though).  In the chapter it also talks about measuring whats nearby using either distance or cost,  it states that you can measure cost in terms of how long it will take to reach points A to B ( I was thinkning like cost as in $, this makes stuff so much more understandable) . The chapter also starts bringing up other topics that I didnt really take into account. For exampke if your measuring travel are you measuring the distance over a flat plane or using the curvature of the earth. ( If im being honest this did not cross my mind but it makes so much more sense to think of this. This makes me wonder if things like google maps uses a flat map or curvature to measure long disances).

Grennell Week 2

Personal summary/Comments

Chapter 1 – Introducing GIS analysis 

Chapter one explains what GIS analysis is and helps us understand what geographic features/attributes are.  For example, the chapter starts by stating that “GIS analysis is a process for looking at geographic patterns in your data and at relationships between features”.  Which is basically saying that, from the layered maps or the collection of maps used to actually do GIS, it’s just an analysis of that data that helps find some sort of correlation to make the data make sense.  That’s what I got, at least; it then goes into talking about what I assume are the steps for GIS analysis.

Step one – Framing your question: this step covers the fundamentals of what you’re actually asking or what you’re trying to prove/show; in the reading, they used “Where were most of the burglaries last month”?  It also states that you should try to be as specific as possible and approach the question with different methodologies depending on what you’re actually asking and how you think it can be resolved.

Step two – Understand your data: this step tells you that, to understand your data, you need to know what’s missing and how to acquire it; the chapter mentions that sometimes one method of looking at data will only get you so far. Which means sometimes you’ll need to either approach it with a different method or gather new layers to help map out the issue.

Step three – Choose a method: the chapter states that there are almost always 2 -3 methods to obtain information. (However, it doesn’t really give you any methods to help you get an actual idea of said methods. Which is a little disappointing)  It then tells you that the same method won’t always be useful; it’s up to the person whether or not they believe said method is viable.

Step four – Look at results: basically states that you interpret the data to help it make sense

Step five – Look at the results: This step states that the results can come in all sorts of ways. Such as maps, charts, or tables. The reason for this is that some questions are just better explained in different expressions than others.

Chapter 2 – Why Map Where Things Are

Based on the title of this chapter, you can assume it was primarily about mapping and why things are mapped. As for the overall objective of this chapter, it was to explain the importance of mapping things, what exactly your mapping is, and preparing/analyzing your patterns/data. The chapter starts by explaining the importance. “Mapping where things are can show you where you need to take action.” In this instance, they go back to their original question of burglary locations or just overall crimes. They then explain that by mapping out said crimes, they are able to create police routes to monitor the areas with higher crime rates. This tied into “what to map” because in this example they wanted to lower crime rates, so they mapped out all the areas with crime, not just some but all crime. They then created a patrol route.

I assumed this is kinda how cops created their routes (not sure if this is even an actual real-life thing or just an example), but it makes sense that this is how they would do it. (Once again, if this is actually how they make their patrols). I also had no clue that GIS could be used for things like this, well not until last week when I officially found out what GIS is.

In the reading, it also talks about categorizing, such as color-coding specified areas so you know what’s where. However, in the reading, they specifically mentioned 3 options.

Option one – Assign a general code to each record in the database, like RUR (Rural) and RES (Residential)

Option two – Create a linked table to match detailed codes with general codes. This one kinda confused me; it showed a picture with RUR (Rural) and RES (Residential) as general codes and some other letters/ numbers as general codes

Option three – Assign categories on the fly by specific symbols (this is the one where everything is color-coded)

Chapter 3 – Mapping the Most and Least

As the title states, this chapter primarily talks about mapping both the most and the least of your specified target. The reason for this is that it allows you to gauge the relationships between them. If you were to only map the most or high end, everything would look relatively bad or good, depending on the topic. (The same effect on the inverse)

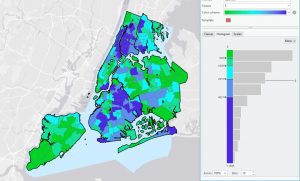
In the reading, it uses mapping both the most and least to effectively track past and ongoing events. One example of this in the chapter they talk about is average annual precipitation. They track both the most and least to help make a gradient of color (dark blue = more rain while light blue = less rain). Now, the reason I chose this one specifically is that this is exactly what you see every day on the news; if you watch a weather channel, they’re going to show the amounts of rainfall, both the most and the least. This helps prove that it’s an effective measure.

Let’s say they focused on the most, and you got rained on because it didn’t make the cut; I know  I’d be annoyed.  So it makes sense that you should include both the most and the least.


Grennell Week 1

I completed the GEOG 291 Quiz and reviewed the syllabus

My name is Elijah Grennell. This year I’m a junior, and I’m double majoring in Biology and Environmental Science. I’m from Whitehall, Ohio, which is a little east of Columbus.  I’m interested in doing Environmental Health and Safety (EHS) after I graduate from college, primarily in manufacturing.  As for why I’m taking this class, yes, it’s a core requirement for Envs. But I wanted to learn more about GIS.

3)

I’ve never heard of GIS until I added Environmental Science as a major my sophomore year. Since then, I’ve heard it all the time from students and faculty; however, I never actually knew what it was. Originally, I thought that GIS was only used for things like research projects that either big companies or universities conduct, but after reading the chapter, I now see that it can be anything. This reading helped me visually understand what GIS is. Before, i though GIS was just one basic overall map that only generally showed a specific item or topic that you were focusing on. However, now I understand that it is more of a group of maps that contain information to help gather awareness (or that’s what I got from the reading…)

One thing that specifically stood out to me was how it can be used to locate clusters of infectious diseases. The idea of mapping out either the locations where the disease/sickness sprouted or spread seems interesting but also quite difficult. Since I want to work in EHS, I think GIS would be a good skill to learn now rather than later. This is because the primary role in EHS is to maintain a safe and suitable environment. If I learn to understand and actually do GIS work, it would allow me to do things such as mapping hazards and air quality around job locations.

Another thing that I found interesting while reading is the origin of GIS; in the chapter, it says that GIS originated in architecture around the 1960’s because of a guy named Ian McHarg. He wanted to find the most straightforward and convenient place to build a new highway, so he made an overlay of drawings/maps of the surrounding area. Just the thought that such a simple idea has now taken such a significant role, not only in architecture but in almost every aspect of everyday life.  I also liked that in the article it’s stated that although it was made for architecture, any group could have come up with the idea.

4)

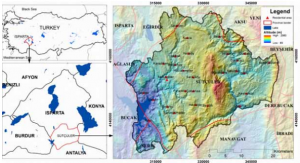
This study researched two species of lizards, Agamidae and Lacertidae lizards found in Turkey, and then tracked their locations. Their goal was to track the lizards and observe their preference in habitat in order to use GIS to find similar ones.  I chose this because I was initially looking for GIS tracking of reptiles as a form of indicator species for environmental change; however, I couldn’t find any. This was still interesting though.

Mert, A. & Kirac, A. (2019). GIS as a tool to map habitat suitability for two lizard species using environmental factors. Fresenius Environmental Bulletin, 28(2A), 1330-1336.