Gullatte week 6

Zip Code: The data set has all zip codes in the Delaware County area. The data set is updated as needed. Zip codes are also cross referenced with the Census Bureau’’s zip code. 

Recorded Document: The data set are points that represent recorded documents. Recorded documents include vacations, subdivisions, centerline surveys. Surveys. Annexation, and miscellaneous documents in Delaware county. It was created to create some kind of order to help locate miscellaneous documents. 

School District: The data set has all School districts in Delaware county. This is updated as needed. 

Map Sheet: The dataset consists of all map sheets in Delaware County

Farm Lot: Data set has all the farm lots in the US Military and the Virginia Military survey districts in Delaware County. This set was made to facilitate identifying all farm lots and their boundaries 

Township: The data set has 19 different townships that make up Delaware County. Updated on a as needed basis. Created to help identify geographic boundaries of each township. 

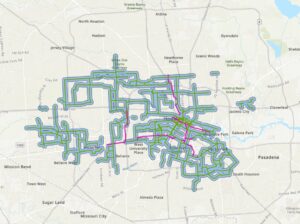
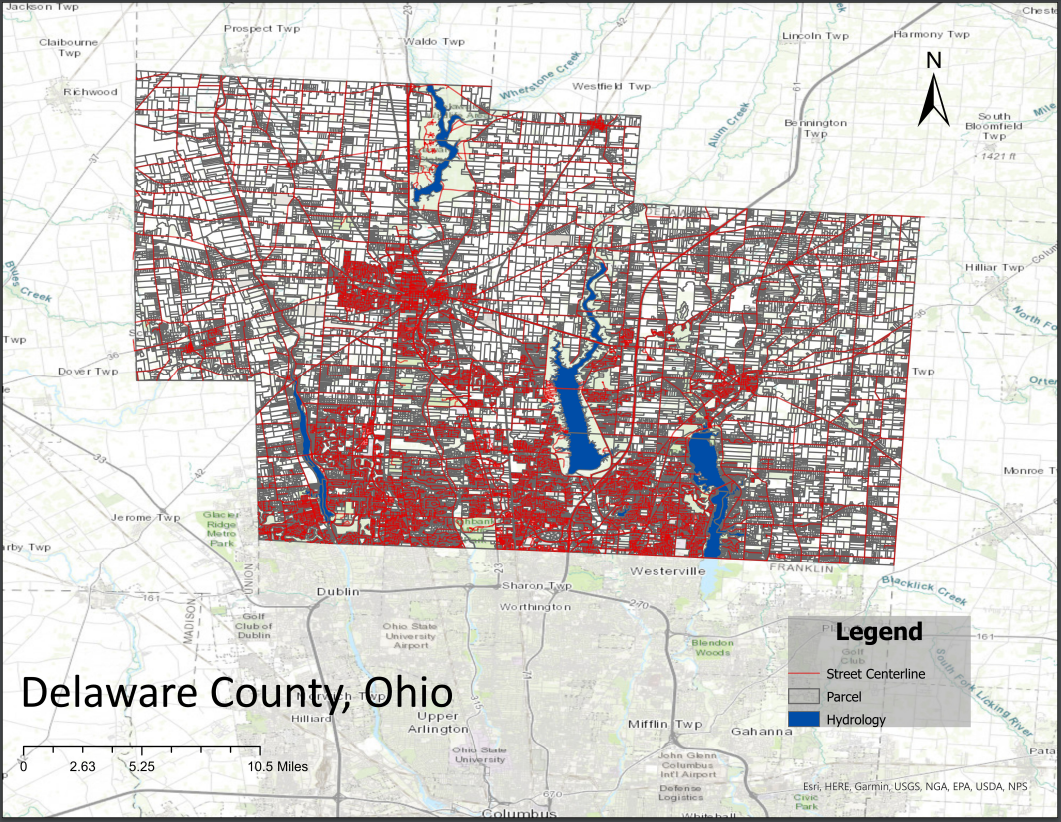
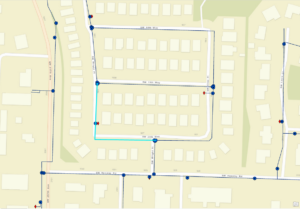
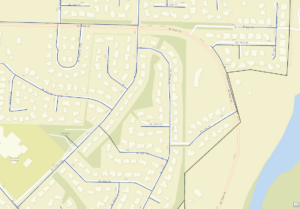
Street Centerline: Ohio Location based response system depicts center of pavement on streets within Delaware County. This was created from field observations. 

Annexation: Dataset has Delaware county’s annexations and boundaries from 1853 till now. Updated as needed. 

Condo: Data set has all condominium polygons in Delaware County. 

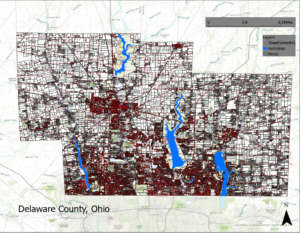
Subdivision: This dataset has all subdivisions and condos within Delaware County. Is updated daily. 

Survey: Points in this dataset represent surveys of land in Delaware County. Dataset updated daily 

Dedicated Row: Data consists of all lines that are right-of-way within Delaware County. Was created through updates through the county’s parcel data. 

Tax district: Dataset consists of all tax districts within Delaware County. Updated as needed. 

GPS: Data shows all GPS monuments that were established in 1991 and 1997. Updated as needed. 

Original Township: Data shows the original boundaries of townships in Delaware county before the boundary shapes were changed. 

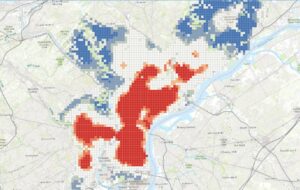
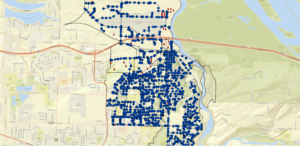
Address Points: The Ohio location based response system data gives an accurate placement of addresses in Delaware County. 

Precinct: Data consists of voting precincts in Delaware county. Updated as needed and maintained by the Delaware County Auditor’s GIS Office. 

Hydrology: Set contains all of Delaware County’s major waterways and updated on a as needed basis. 

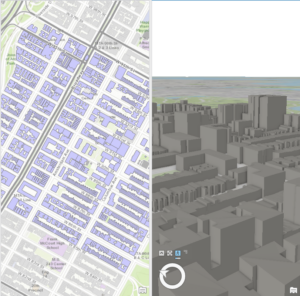
Building Outline 2021: Set has all building outlines of structures in Delaware County. 

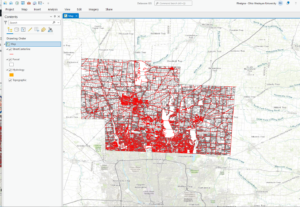
Parcel: Consists of all cadastral parcel lines in Delaware County. 

PLSS: Set contains all Public land surveys systems in the US Military and the Virginia Military Surveys Districts of Delaware county. 

2022 Leaf-On-Imagery: 2022 Imagery 12 in Resolution??

Delaware County Contours: 2018 Two Foot contours. 

Delaware County E911 data: Ohio’s location based response system data set is an accurate representation of all certified addresses in Delaware county. Intended to support mapping, 911 emergency response, accident reporting. Geocoding, and disaster management. 


McFarland Week 6

Delaware County Data:

Zipcode: Contains all of the zip codes that are represeted in Delaware County. Data based on Census Bureau zip code files, and is updated on an as needed basis.

Recorded Document: Contains points for recorded documents. Documents include: vacations, subdivisions, centerline surverys, surveys, annexations, and miscellaneous documents within the county.

School District: Contains all of the boundaries for all of the school districts represented in Delware County. Updated as needed, and published on a monthly basis.

Map Sheet: Consists of all map sheets in Delaware County. All individual map sheets correlate to a numeric value to help distinguish between certain areas.

Farm Lot: Contains al of the farm lots in Delaware County. Data is based on US Military and Virginia Military surveys.

  • Kind of confused on why the whole county is broken into farm lots, but i’m thinking it was how it was originally divied up during westward expansion. Not sure, though.

Township: Contains all 19 townships that make up Delaware County. Updated on an as-needed basis and published monthly.

Street Centerline: Represents the centerlines of all public and private roads within Delaware County. Updated on a daily basis as it is intended to support 911 emergency responses, accident reporting, disaster management, and more.

Annexation: Shows all of the annexations and conforming boundaries from 1853 to present day. Updated on an as-needed basis and published monthly.

Condo: Contains all condominium complexes in Delaware county. Based on data from the Delaware County Recorders Office.

Subdivision: Consists of all subdivisions and condominium complexes in Delaware County. Updated daily and published Monthly. A subdivision is a parcel of land that is divided into two or more pieces for sale.

Survey: Represents the many surveys of land within Delaware County. Updated daily and published monthly.

  • Not sure what the surveys represent, but there is a lot of data in this shapefile.

Dedicated ROW: Represents all Right-of-Way lines within Delaware County. Updated daily and published Monthly.

  • Not sure how this layer really works or what each section represents, but it looks interesting!

Tax district: Contains all tax districts within Delaware County. Data is based on the Auditor’s Real Estate Office for the county.

GPS: Identifies GPS monuments that were establushed in the 1990’s. Updated as-needed and published monthly.

  • Again, not sure what these monuments are or what their GIS implications are, but looks interesting nonetheless.

Original Township: Consists of the original township boundaries in Delaware County. Unaffected boundaries before tax district changes.

Address Points-DXF: Contains points for all addresses in Delaware County. Maintined by the county Auditor’s GIS Office. Points represent the center of each building “as best as possible”.

Precinct: Represents all voting precints in Delaware County and is based on data from the County Board of Elections. Both updated and published as needed.

Hydrology: Consists of all major waterways in Delaware County. Data was enhanced in 2018 with the use of LIDAR data.

  • LIDAR is light detection and ranging.

Building Outline 2021: Shows all building outlines in Delaware County. So much data in this layer that you need to zoom in to view the outlines.

Parcel: Represents all cadastral parcel lines within the county. Data maintained by the County Auditor’s Computer Aided Mass Appraisal system.

PLSS: Consists of all Public Land survey polygonsin the county. Data is also based on Military survey data from US and Virginia Militaries.

Street Centerlines- DXF: Another representation of street centerlines for the LBRS. The LBRS is The State of Ohio Location Based Response System.

Address Point: Spatially accurate depiction of certified addresses in the county. Used to determine the closest valid address from a set of coordinated for 911 responses.

2022 Leaf-On Imagery: Imagery from 2022 12in Resolution.

Delaware County Contours: 2018 Two Foot Contours for the county.

Building Outlines – DXF: Another representation of building outlines in the county.

  • DXF stands for Drawing Exchange Format, which is a “legacy format originating in the CAD industry to exchange 2D vector data” as defined from the arcgis website.

Delaware County E911 Data: Another representation of accurate certified addresses in the county used for 911 responses.

ArcGIS:

Here’s my final map with all three instructed layers along with a scale bar, legend, north arrow, and title. Unfortunately, my screenshot is horrible quality. Also, I had to unzip all of the files to be able to drag them into ArcGIS.


P.S. Thanks, other logan for the idea of creating a whole layout rather than just a screenshot with the visible layers.


Brokaw week 5

Chapter 5: went smooth for the most part. Making the ModelBuilder ribbon was cool. I think I did the Python coding correctly.  

In chapter 6 I ran into an issue with publishing features and preparing the map for collection. My content did not have the TreeInventory feature layer. 

Chapter 7: I made some mistakes in the Geocoding process. I could not add the files to the map. I think there was also some confusion with me and labeling that I had messed up in the last section. 

Chapter 8: Was a cool way to make 3D maps. However, I think I made some errors while browsing and couldn’t find the correct file. I’m not sure which chapter but I did have an issue with an error coming back after running a tool. It said the function couldn’t be performed because it was already added. 


Chapter 10: I had a slight issue but just skipped the steps and moved on. In exercise 10b step 10 it wanted us to go to the position tab however there was no placement drop down or in the next step there was no stack drop down. Also in exercise 10c I could not figure out how to insert the Max Advertised Broadband speed map frame into the layout tab. It kept making another separate tab. 

Mattox Week 5

Week five work went smoother than week four but there were still some chapters I just couldn’t really get to do what they were supposed to. Over all though I feel like I was more comfortable with the software this time around so I felt a lot better about the exercises that went well. I felt like I could navigate everything pretty easily and even though there were still some funky hiccups I think I understand things better now.

Mattox Week 4

Towards the beginning of the week four work, I didn’t have technical things figured out yet so I was unable to get very far with a few of the exercises but I figured some things out and it went a lot smother in the later chapters of this week.  

These ones went well

These ones did not

Gullatte week 5

These chapters were fairly self explanatory, I only got stuck a few times but was able to skip and navigate the rest of the chapters easily. My problem is that I am inpatient and I don’t like to read everything on the screen so I miss things. The most interesting thing in these chapters for me was doing the South Sudan coding. I think it was cool to input South Suden is equal to the years or whatever the directions said. It was cool that the map and software could do that. Again, I took definitions because some of the words in the chapters were hard to understand without knowing the definitions. 

Defintions:

Task: [software] A set of preconfigured steps that guide users through a sequential workflow in ArcGIS software. 

Definition query:[ESRI software] In ArcMap, a request that examines feature or tabular attributes based on user-selected criteria and displays only those features or records that satisfy the criteria.

Query expression: [programming] A type of expression that evaluates to a Boolean (true or false) value, that is typically used to select those rows in a table in which the expression evaluates to true.

ModelBuilder:[ESRI software] The interface used to build and edit geoprocessing models in ArcGIS.

Model:[data models] An abstraction of reality used to represent objects, processes, or events.

Script: [ESRI software] In ArcView 3.x, one of the five types of documents that can be contained within a project file

Command line:[computing] A string of text that acts as a command, typed at an interface prompt.

Geocoding:[geocoding] A GIS operation that converts a street address or other location information into spatial data that can be displayed as a feature on a map.

Adress Locator: [geocoding] A dataset in ArcGIS software that stores the address attributes, associated indexes, and rules that define the process for translating nonspatial descriptions of places, such as street addresses, into spatial data that can be displayed as features on a map.

Overlay: [analysis/geoprocessing] A spatial operation in which two or more maps or layers registered to a common coordinate system are superimposed, either digitally or on a transparent material, for the purpose of showing the relationships between features that occupy the same geographic space.

Buffer:[spatial analysis] A specified zone around a map feature or features, measured in units of distance or time. 

Dissolve: [ESRI software] A geoprocessing command that removes boundaries between adjacent polygons that have the same value for a specified attribute.

Clip: [ESRI software] A command that extracts features from one feature class that reside entirely within a boundary defined by features in another feature class.

Temporal Data: [data structures] Data that specifically refers to times or dates. 

Operator: [mathematics] The symbolic representation of a process or operation performed against one or more operands in an expression, such as “+” (plus, or addition) and “>” (greater than). When evaluated, operators return a value as their result. 

Cell:[graphics (computing)] The smallest unit of information in raster data, usually square in shape

Discrete data: [data models] Data that represents phenomena with distinct boundaries.

Continuous Data: [data models] Data such as elevation or temperature that varies without discrete steps

Map algebra: [data analysis] A language that defines a syntax for combining map themes by applying mathematical operations and analytical functions to create new map themes. 

Aspect: [analysis/geoprocessing] The compass direction that a topographic slope faces, usually measured in degrees from north

Hillshade:[map design] Shadows drawn on a map to simulate the effect of the sun’s rays over the varied terrain of the land.

Azimuth: [analysis/geoprocessing] A compass direction. 

Altitude: [coordinate systems] The height or vertical elevation of a point above a reference surface

Layout: [ESRI software] In ArcGIS software, a presentation document incorporating maps, charts, tables, text, and images.

Label: ESRI software] In ArcGIS, descriptive text, usually based on one or more feature attributes

Label class:[ESRI software] In ArcGIS software, a category of labels that represents features with the same labeling properties.

Map extent: [cartography] The limit of the geographic area shown on a map, usually defined by a rectangle.

Scale bar: [symbology] A map element used to graphically represent the scale of a map.


fraire week 6

Delaware Data Info:

Zip Code: All the zip code areas for Delaware County. Updated regularly/as needed

Recorded Document: shows the places where recorded documents such as plat books are located (books that show how the county property is divided/landlines). other info on data collected on these lands such as annexes, surveys, etc. is also stored and represented by the dots for where they are kept.

School District:  All the school districts within Delaware County.

Map Sheet: all map sheets in Delaware County.

Farm Lot: Map of all the farm lots in Delaware County provided by the US military and Virginia Military Survey Districts.

Townships: Shows the 19 townships in Delaware County,

Street Centerline (data)/ Street Centerline – DXF (document): All documented private and public roads in Delaware County. Put together using observational data, regularly updated/as needed.

Annexation: Delaware Counties’ annexed land and growing boundaries from 1853 to the present. Annexed land means land that was taken into the city limits.

Condo: All recorded condominium polygons in Delaware County.

Subdivision: All subdivisions and condos in Delaware County.

Survey: Shapefile of all survey points taken in Delaware County, excluding old surveys in volumes 1-11. All are certified surveys and more after 2004 are being added regularly.

Dedicated Row:  All road right-of-ways ROW owned by the city. These are the areas of grass/sidewalk on the side of a road that is owned by the city. Not all roads have one.

Tax District: All tax districts in Delaware County.

GPS: All GPS monuments from 91-97. Uses Universal Mercator Northing and Easting.

Original Township: Original township and boundaries before tax districts changed shape.

Address Points (data)/ Address Points– DXF (document): Point layer of all address points in Delaware. Intended to support appraisal mapping, 911 Emergency Response, accident reporting, geocoding, and disaster management. The layer provides the capability to reverse geocode a set of coordinates to determine the closest valid address.

Precinct: Voting precincts in Delaware County.

Hydrology: All major waterways in Delaware County.

Building Outline 2021 (data)/ Building Outlines – DXF (document): All building/structure outlines as of 2021.

Parcel: Cadastral Parcel lines in Delaware County (property lines for real estate). Also holds appraisal information.

PLSS:  created to facilitate identifying all of the PLSS and their boundaries in both the US Military and Virginia Military Survey Districts of Delaware County. PLSS is a survey system made in 1785 to establish parcel lines with a standard system.

2022 leaf-On Imagery (SID) (Map): 2022 Imaergey 12in Resolution map. A SID file is a compressed file of GIS data.

Delaware County Contours: 2ft contours of Delaware County from 2018.

2021 Imagery (SID File) (Map): just saw “Delaware County Ohio”.

Delaware County E911 Data: all certified addresses in Delaware County. Provides the capability to reverse geocode a set of coordinates to determine the closest valid address and is intended to provide 911 agencies with the information needed to comply with Phase II 911 requirements.

ArcGIS Pro Portion:

I have absolutely no idea why but when I save my map exports as PDFs it has the .pdf tab but it saves as a Chrome HTML?? When I open it it takes me to the PDF but why is it online? Here’s my map though (I should have probably made the map more zoomed in):

Weird PDF link: DelawareCountyMap

Screenshot of PDF:


McFarland Week 5

Chapter 5:

This chapter was a lot easier now that I know the basics of the software from last week’s chapters.

A)

B)

C)

I did the entire chapter without many issues, but when I tried to package it, I got an error message that my map has no layers.  Not sure what to do about this because my map definitely has some layers.

Chapter 6:

A)

Not much to show for this section, but I’m starting to get more confident using the software. We’ll see how long that lasts!

B)

C)

I can’t seem to find the ArcGIS Collector app anywhere on the IOS app store.

Chapter 7:

A)

B)

I am doing all of the steps correctly, but to be honest I’m not confident I know exactly what I’m doing.

C)

Chapter 8:

A)

Not sure how to access the appearance tab to change transparency. (Update: I figured it out)

b)

C)

D)

Made a cool animation of changing robbery demographics, unfortunately this is only a screenshot. Sorry!

Chapter 10:

A)

B)

Messed around with labeling libraries in Salt Lake City!

C/D)

My final layout below!

Note: Downloaded three assigned .shp filed from Delaware GIS Data Hub.


fraire week 5

Chapter 5

first step in tasks, I want to break down what I did. County is equal to South Sudan (only select South Sudan) and Year is >/= to 2011 (South Sudan data from 2011+). This task thing was very strange I’ve never used it before.

It was interesting learning tasks but I don’t think the text explained what this step was adding very well.

I prefer the model builder to the task route visually but the modelbuilder lacks the instructions given when using tasks so its a give and take. Here’s me running my model:

I haven’t started it just yet but I am scared to run Python code. I don’t want to run it I’d rather use the tasktool or modelbuilder >:(

When I tried to package my project I got a “conflict” saying that a geoprocessing item failed and it couldn’t package it. This was weird because I didn’t have any failed codes, but I fixed it by removing items with errors. I wasn’t feeling very extra so I skipped the “on your own” here where I check to see if this uploaded to my online account.

Chapter 6

Here is my created symbols for the trees:

It wouldn’t let me name the project “TreeInventory” for ArcOnline (it says the name is taken) so I added my name to the end “TreeInventoryFraire”.

My map for ArcOnlinne so far:

For the app thing, there is no app called “ArcGIS Collector” so I downloaded the first one that popped up called “ArcGIS Field Maps and it took  forever.

Well I downloaded it and then it said that I don’t have permission to use the app so I had to skip this part.

Attempt one at editing the new features attributes:

I got through his exercise but it was weird. I had to keep reopening my project because the program was losing its location and said it didn’t exist. I think this screwed with the portal linking to my online account because after refreshing and readding the layer it said that it couldn’t find it either. I think it might be because I had to give the online layer a different name since the map name was “already in use”.

Regardless, I now know multiple ways to edit maps from many devices!

Chapter 7

Starting off strong with more so actions like “join these two layers” instead of a step by step. Getting harder! Let me know I need to pay attention to what I’m doing more.

When I tried to save the locator it originally said that a parameter was missing. I think it was because I put “Houston_” and not “Houston_Locator”. File names are important (And annoying).

I don’t really understand what rematching did. I read the text and it’s still a little confusing. I have actually little to no idea what this did. Did it just match addresses that are the same but weren’t classified as the same?

My map after doing the merge, dissolve, and selected specific properties within the buffer:

When I opened the attribute table after the spatial join I only saw one row of data…I chose the wrong input for my spatial join! went back and fixed that annnndd it still looks the same D: Looking at the attributes of the buffer, it only shows one row of data as well.. I’m not really sure why this happened. My clipped layer and the following selection layer look fine in the attributes. Tried for a third time and it worked! I think I was selecting the wrong inputs, pay attention Logan.

Our pop-up menus look very different than the book.

My final map of this exercise with some selected prospective property locations, proposed/existing bike paths, and bike stations:

Chapter 8

My first map of robberies in January, how exciting:

I didn’t really consider the applications of GIS with crime. It obviously makes sense but it just adds another use of GIS for me.

Every time it says “run the tool” it reminds me of the artist group Run the Jewels 

negative points for bringing in the empirical rule and z-scores. Stats = no.

I hate this:

real vomit from all these cubes. It feels like the matrix:

I don’t want to work documenting crime spots, that’s for sure.

I did 8c and got the mods done. I just noticed that there is no topography for this scene. Not really a problem because I can work but odd:

Range and time on crime son (it’s playing in the picture so it looks a little empty right now):

Chapter 9

I started by extracting masks and mosaicing layers to make this property boundary:

Running the aspect tool and seeing the colors brings back trauma from remote sensing. I know these colors all correlate to the cardinal direction of the slope.

When adding the outline to the planting sites I made it purple instead of black because it was hard to see on the hillshade that was already greyscale and the slope added green/red. I promptly changed it back after adding the slope.

Here is my map with the property boundary, vineyard blocks, and planting sites. I also have on the 3pm hillshade shadow. There is limited area for planting on this property:

This modelbuilding reclassification probably won’t work. I don’t have a start and end column, only value and new.

My finished maps after raster calculator (which was being a little stinker). The dark red shows the most favorable planting sites within the black outline:

Chapter 10

My first map for 10a:

I didn’t have a symbol selection in my label ribbon. I had to right-click the layer and select labeling properties to get to the symbol tab it asked of me.

My created labeled map of Utah:

My finished layout of broadband speed/libraries in Utah County. (I have no idea why it made the pdf a html link? This has never happened to me before. I included a screenshot of the map because the link doesn’t even work.)

Layout1


Brokaw week 4

In ArcGIS pro we will be completing projects that have maps, layouts, layers, tables, tasks, tools, and connect to servers, databases, folders, and different styles. ArcGIS Online is public content that if connected to an organization you can share projects and information. Geoprocessing tools will perform spatial analysis and manage GIS data. Cluster → aggregating. 

I ran into an issue that there was not a purple school symbol so I substituted a blue school symbol. There must’ve been an update with symbols. The ToBreak attribute helps to show how many minutes walking a distance is. I got stuck on chapter 1, step 9 “Under Try a drawing style, select Types (unique symbols). I could not find “Try a drawing style”. I ended up stopping for the day and came back and found it. After just starting exercise 2B I ran into a labeling issue. The appearance tab is now labeled as “feature layer”. It was cool to transform my map into a 3D form and use the explore tool to navigate around. When trying to export their selection to a new dataset I ran into issues at #3 in the Geoprocessing pane. All of exercise B was messed up and I had questions about a step that was very important because it carried over into exercise 3B. Stopped at page 91 on Import layer symbology. I ended up completing chapter 4 but could not save any progress because of a computer issue.