Chapter 7:
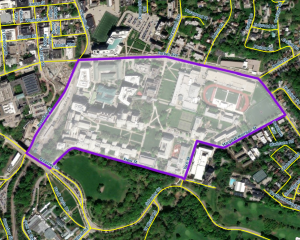
This chapter focuses on digitization using multiple GIS features. The first section of this chapter details editing polygon features. Using the select tool is pretty self-explanatory: you are just selecting features. Then the user must click the move button to move and rotate the buildings as such. They can also add or move vertex points (an ordered pair that defines a polygon feature). The part I struggled with most was splitting features; it kept giving me error messages. Eventually, I figured it out and moved on to the next section. The next part had us delete and create polygon features. This section of the chapter was straightforward and had the most fun with it. Created some of my own polygon features just for the pure enjoyment of it. The following section had us use cartography tools. We used the Smooth tool, which improves the appearance of polygons so they’re more rounded and are less boxy. You could say it was aesthetically pleasing to the eye. The final thing this chapter goes over is how to transform features. It covers georeferencing to help us locate places in a specific area and transformation tools to move buildings to a more precise location. I found this part of the section a bit challenging because, for some reason, even when performing the transformation. The building wouldn’t move to the right spot. It would literally barely move at. I traced back my steps and found out I got the target points mixed up somehow. Regardless, overall I thought this chapter was interesting. As the chapter goes on, we get more hands-on experience and learn even more about what GIS could offer. Just a couple of weeks ago, I barely heard of this program, and now I can do so much more with it.
Chapter 8:
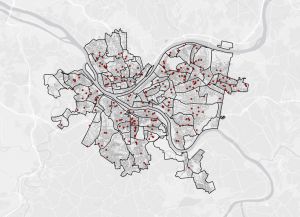
The previous chapter discussed digitizing polygon features, spatially adjusting them, and working with CAD (computer-aided design; files you can open and read without converting them). drawings. Chapter 8 goes into detail on geocoding, covering the overall process, geocoding with ZIP codes, and finally geocoding addresses using streets. The first section had us use ZIP codes with geocoding data. We also used a new tool called Create Locator. This utility helps us look up a specific location. Then we used the Geocode Addresses tool to convert a table of street addresses into features on a map. Another new thing I learned in this chapter is how to rematch data by zip code. This lets the user correct and review any addresses that weren’t matched before. After that, we were shown how to symbolize using another new tool. Called collect events, which takes data and puts it into a new feature class. This tool counts the ZIP codes and applies graduated symbols to them. The other half of the chapter has the user geocoding street addresses. The Create Locator tool appears again, but instead of using ZIP codes, it uses streets. Later, we use the same tool again, but with street addresses. Once that is done, then we move on to selecting minimum candidate and matching scores. This part was really easy, and it didn’t require much menu jumping. Anyone (in my opinion) could do this part in a short amount of time. The last thing this section has us do is produce the final geocoding results. The definition query tab helps define the results even more. Chapter 8 showed us the importance of geocoding. It also included some explanations here and there. Not only that, but the activity itself helped us along the way to better understand the processes behind it.
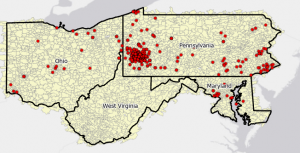
Chapter 9:
Chapter 9 discussed geocoding processes and geocoding with ZIP codes and street addresses while working on CAD designs. This chapter focuses on spatial analysis. Showing us how to create single and multiple ring buffers for proximity analysis. It uses gravity models for service areas to detect distance and perform cluster analysis. The first section of this chapter has us create buffers. The use of buffers hasn’t been mentioned since the Mitchell book (I think). This is done through the Pairwise Buffer tool, creating a “zone” around the radius of each feature. To add multiple ring (M.R.) buffer zones, we use the same tool that has the same name. Then, a spatial overlay is used to combine all the attributes of the multi-ring buffer we had just created. The next section has us create M.R. service areas for a gravity model (a prediction model showing how things move between two places). As done previously, the M.R. function is used with a spatial join. Then we calculate the statistics of pools in service areas. Then a scatter plot is created to best represent that information. The section after uses the network analysis tool to locate facilities. Starting by locating the attendance of some pools. This is done through location-allocation, which shows the best locations and connects facilities to the people who need them. The following result would look like a bunch of fireworks going off in different parts of the map. (Though I’ve seen others call this more like a web.) After that, we perform a data cluster analysis. This is done with the tool called Multivariate Clustering, which groups map features into clusters based on numeric attributes. This chapter has shown me that imagery is not the only way to help users meet their needs. Logical methods, along with certain data, can go along way a really long way.
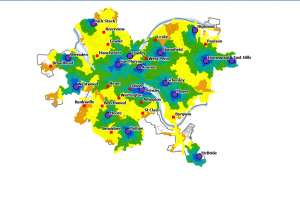
Chapter 10:
Chapter 9 had us go over single and multiple buffer zones, creating service areas of facilities, locating those said facilities, and performing cluster analysis. The following chapter is more complex but very intriguing and useful. Focusing on using raster GIS, which uses continuous layers like precipitation and topography to display data. We start by reviewing the properties of a raster dataset. Next, we import a new dataset using a new tool called Raster to Other Format. This converts one or more raster datasets into a different file format altogether. We set the environment for analysis and then extract the land use file with another new tool called Extract by Mask. This cuts the datasets down to a specific boundary. One thing that really caught my interest in this chapter was setting up elevation using Hillside. After using section hillside, we lead into Chapter two having the user create a kernel density map, showing a smooth raster surface that displays density within an area. Setting this up required using multiple tools back to back. Kernel density, contour list (creates a class of contour values from a raster surface), feature to polygon (creates a class from line or polygon features), and summarize within (calculates various things for features inside polygons). The last section of this chapter was the most exciting part (for me), and it deals with model building. The model-building layout reminds me of a Python flowchart. When I first saw it, that’s what came to mind. The buildup and the result of that buildup reminded me so much of coding in general. If I had to say what it was like, it would be similar tp building Legos. It can be easy and frustrating at times, but the results are worth it. Just like the map creation of this section. Putting me in straight awe of what I can create.
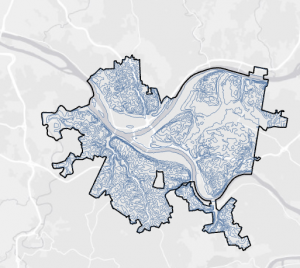
Chapter 11:
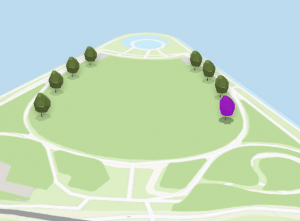
The final chapter within our GIS journey has us handling 3d once again. The use of 3d hasn’t really been mentioned in a couple of chapters. Nonetheless, this chapter has been enjoyable overall, with so many features to explore. The very first section has us exploring the global scene. Learning how to apply map shading and use certain keys on a keyboard for viewing. Section 2 had us create a local scene and a TIN surface (triangulated irregular networks). The process was easy until I got to the Draw Using function, using symbology to color a surface. Once I resolved that issue, I moved on to creating z-enabled features. Where z is used for height in a 3d setting, along with length and width (x and y, respectively). Funny enough, I thought GIS never has selectable 3D assets. Spent a couple of minutes looking around to see what other features the program has. After that, we created features and a line of sight using lidar. Like before, I ran into issues and was a bit confused about the setup. One thing I found cool was creating a raster DTM and creating random points for buildings. It had me eyeing the map for a good minute. The bridge part was another thing I found really cool. Once that section was over, we worked with 3d features. This required the user to set up building floors and tower heights. The second-to-last section went over procedure rules and multipatch models (an outer shell of a model). The very last section of the book, though, caught me off guard. It had us create animations within GIS, which is something I originally thought the program didn’t do. It was quite surprising, to be honest, and easy to use. Though trying to export an animation from here took forever.