Chapter 1:
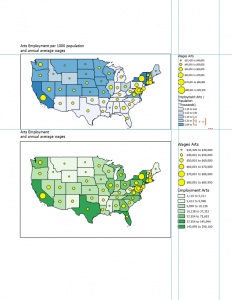
Before the start of this chapter, I thought using GIS was going to be pretty straightforward. The setup process was pretty easy. When I finally opened and ran the program, it looked pretty intimidating. So many buttons, sections, and menus to click through. One common thing I kept running into was the book’s broad directions when it came to finding menus. That made finding them a bit difficult. It took a good minute to get used to everything. Overall, I thought the workflow was fun, even though it was challenging to use, especially at first. The first chapter covered a few things, from the introduction to the GIS program to working with 3d3Daps. This chapter also covered some of the topics mentioned in the Mitchell book. Some of the included terms were classes, features, maps, etc. Part 1 was just a general overview of the program, understanding some of the basic concepts of it. The next section showed us how to navigate the program, which did help trying to move around the app program a bit easier. The next section had us working with attribute data, which lets the user search for features on a map and find necessary information. Section 6 had us symbolizing maps, turning raw data into visual information that everyone can see. This section was the most interesting because it involved setting up the overall map. I was trying to get all these bits and pieces to come together and turn them into a final product. One thing I was toying with for a good minute was the 3-d maps. After doing the labs for Chapter I, I felt generally really excited about learning to use these new programs. I look forward to the rest of the chapter and what it could offer down the line.
Chapter 2:
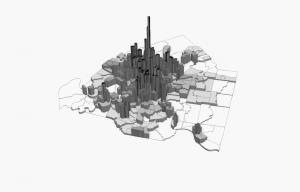
Chapter 2, just like Chapter 1, still felt like moving into a new world. Throughout the process, I was still trying to get used to the menus. Knowing where to find things, which sections they are in, etc. Chapter 2 goes into more detail about designing a map. A good chunk of the information on how to make a good map (depending on the data you’re presenting) was talked about previously. That gave me a decent understanding of what to expect in this chapter. Chapter 1 had us symbolizing qualitative attributes, learning how to symbolize features based on their code. The next section, my favorite section so far, was labeling features and how to configure pop-ups. Finding out what pop-ups are in GIS caught me a bit off guard. Regardless, it was one of the easiest sections of the chapter. Section 3 was the most interesting one, showing us how to filter information by defining queries. The next one discussed how to make choropleth (I’d never heard this word before) maps for quantitative attributes, but this section was the most enjoyable. Section 5 made us create maps with dot-to-scale references and gradients. Making dot density maps was the most interesting, and I spent maybe 30 minutes toying around with some of the features. Just to see what the end result would look like. My attitude toward GIS changed by the end of chapter 2. Searching through menus has gotten easier (the book was hit or miss), making the process of going through these labs much quicker. When working through this chapter, I started clicking through the menus more, trying to figure out each one’s function. Most of that time was spent working on section 3. Regardless, I had a fun time working with this chapter, and everything that I had to do in it.
Chapter 3:
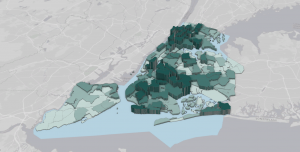
Chapter 2, just like Chapter 1, still felt like moving into a new world. Throughout the process, I was still trying to get used to the menus. Knowing where to find things, which sections they are in, etc. Chapter 2 goes into more detail about designing a map. A good chunk of the information on how to make a good map (depending on the data you’re presenting) was talked about previously. That gave me a decent understanding of what to expect in this chapter. Chapter 1 had us symbolizing qualitative attributes, learning how to symbolize features based on their code. The next section, my favorite section so far, was labeling features and how to configure pop-ups. Finding out what pop-ups are in GIS caught me a bit off guard. Regardless, it was one of the easiest sections of the chapter. Section 3 was the most interesting one, showing us how to filter information by defining queries. The next one discussed how to make choropleth (I’d never heard this word before) maps for quantitative attributes, but this section was the most enjoyable. Section 5 made us create maps with dot-to-scale references and gradients. Making dot density maps was the most interesting, and I spent maybe 30 minutes toying around with some of the features. Just to see what the end result would look like. My attitude toward GIS changed by the end of chapter 2. Searching through menus has gotten easier (the book was hit or miss), making the process of going through these labs much quicker. When working through this chapter, I started clicking through the menus more, trying to figure out each one’s function. Most of that time was spent working on section 3. Regardless, I had a fun time working with this chapter, and everything that I had to do in it.