Apologies for the bad screenshots. The direct screenshot tool on my windows computer was not working or I couldn’t get it to work. So I started off by taking pictures through my phone, emailing them to myself, downloading them, and then uploading them. I think I have figured out what I was doing and how to work the screenshot feature so I should be good now.
Preface).
This background information is helpful. I like the reference to ArcGIS StoryMaps and ArcGIS Dashboards that we learned more about in the chapter 3 tutorial this week. I now better understand the functionalities of Esri. And above all, I like that we are working with real world data in an attempt to critically engage real world problems.
Chapter 1).
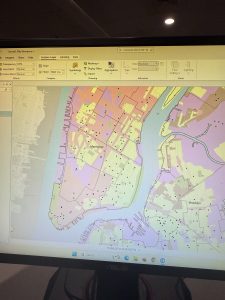
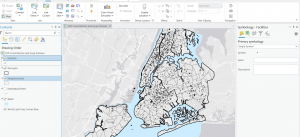
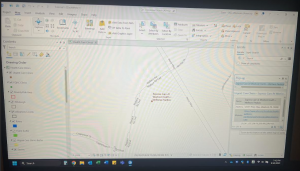
For tutorial 1-1, I added and removed the world topographic base map. I also did the word terrain with labels base map and this one seemed to provide relevant information. There is a lot of info but I like how it blended and appeared to fit well in terms of giving useful details about the terrain inside and out of the focus county. I then did the world light grey with canvas base map to practice removing the base map as well as the labeling layer associated with the contents pane.
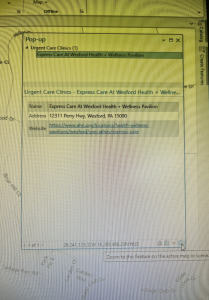
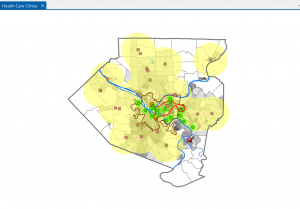
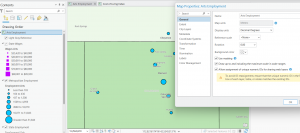
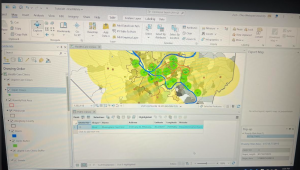
For tutorial 1-2 I have a picture showing the pop up window off to the side and then a zoomed in view of this particular feature using the zoom to this feature tool. As you can see the street feature class is activated and names of the streets are showing. We can also see the specific clinic labeled with its name. Next, I did the zoom in exercise where I positioned my pointer at the intersection of the three rivers and tapped the plus key. On the left side under contents, the FQHC Buffer class is turned off or not showing at this scale while the Urgent care clinics class is activated and displayed on the map. A good thing to remember is that the pointer is ready to pan in/out or up/down when the explore button is activated under the map tab navigate grouping.
For tutorial 1-2, I also did the search for a feature process particularly the McKees Rocks feature. What occurred was that the selected record was shown and I zoomed to that feature selection on the map. This process was pretty simple and I think useful. Lastly for this 1-2 tutorial, I’ve included a screenshot of the work I did when searching for the Birmingham Free Clinic feature under the your turn part.
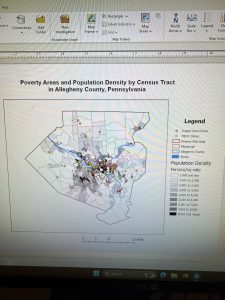
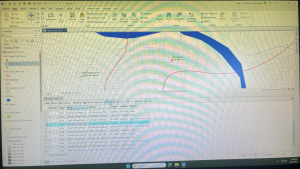
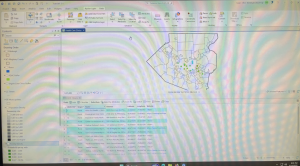
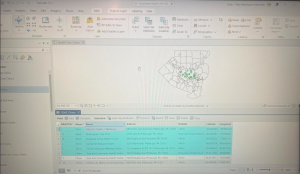
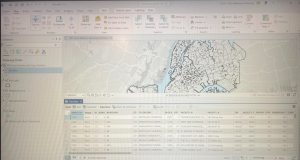
For tutorial 1-3 I furthered my understanding of opening an attribute table, paying attention to attributes of interest, editing the table to make it more readable, and sorting things around to find a particular census tract of FQHC. I also worked on changing the order, name, and other details of attributes within the field view. I included a screenshot of my work for the first my turn exercise in this section. I opened an attribute table for population density, took note of three principal attributes of interest, and then used sorting to seek out the census tract with the highest population density. When I found this I selected it in the table and it showed on the map in the same color as a mini circle. I have another screenshot of the second your turn exercise in which I opened the attribute table for streets, changed a field name, made a total of seven fields visible and then closed everything out. You can see the new alias name I added in the attribute table once the fields view was closed out. In my next photo I was working on selecting records and features of a map feature class and this is important as many GIS functions work with select subsystems of records and features. I like that when the records are selected the features show up on the map. What’s cool is that we can work with and select and reselect any subset of features.
I then learned how to obtain summary statistics for attributes and for analysis.
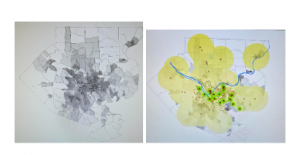
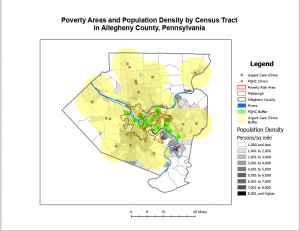
Moving on to tutorial 1-4, I learned about symbolizing maps. For the first my turn exercise in this section I worked on symbolizing a particular feature class in the poverty risk area. I modified the outline width and changed the color of the line. I like that we can go into the database and add feature classes. We also have the ability to remove feature classes as needed.
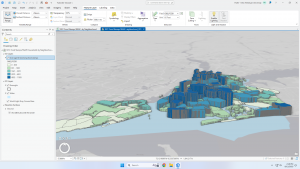
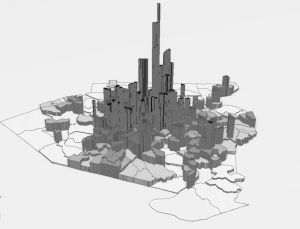
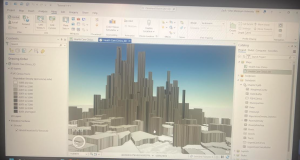
I have included a screenshot of navigating the population density feature class with its 3D version map. This was really cool to see how different it looks than just using the colors. You can see and feel the differences in a more meaningful way with this version map.
Chapter 2).
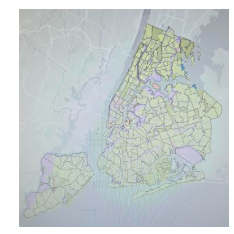
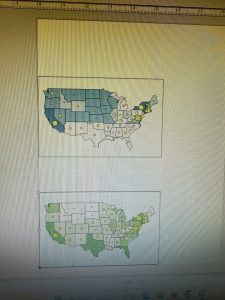
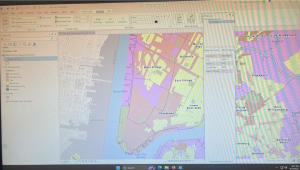
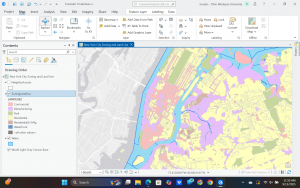
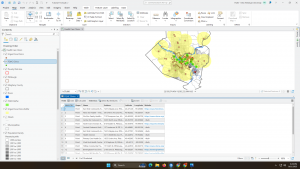
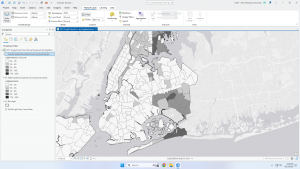
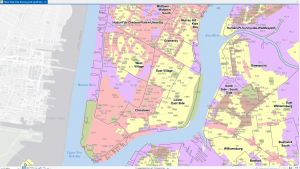
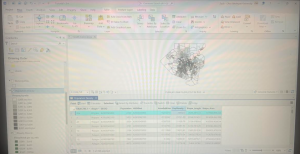
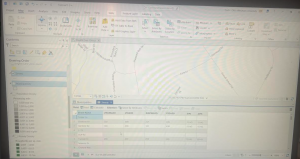
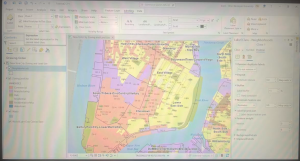
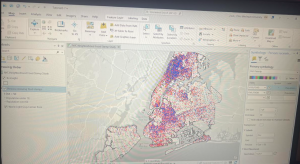
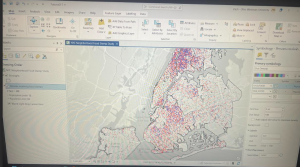
In chapter two, I learned about symbolizing maps, explored 3-D scenes, implementing graduated and proportional point symbols, formulating normalized maps with customs scales and dot density maps. Finally, I worked on adding visibility ranges for labels and layers to enhance interactivity with the map. If I could get more practice with one thing here it would be using definition queries for the creation of map subside features. While I had no problems walking through this in the tutorial, this along with other things is something I will need to come back to review when attempting to perform another time. I included a screenshot of the your turn exercise for tutorial 2-2 in which I worked on labeling features and configuring pop ups. There is also this component of symbolizing qualitative attributes on display in this screenshot for example with the neighborhood and water polygons. In chapter 2 I also worked on creating a definition query. I included a screenshot of this and the resulting map is a subset (631) of the original 20,000-plus facilities showing just food pantries, soup kitchens, and joint soup kitchens and food pantries. One of the last things I did in this chapter was worked to create a dot density map. I like that more than one variable can be shown at a time, something we found the choropleth maps could not do. To that point, however, it gets a bit overwhelming in terms of visual convenience looking at a bunch of dots. In order to combat this, in the your turn exercise at the end, I change the dot value or the number of people that each dot represents to a greater number. I included two screenshots, where the first one is the original map I made and the second one shows the change in density and how it becomes a bit easier to process visually.
Chapter 3).
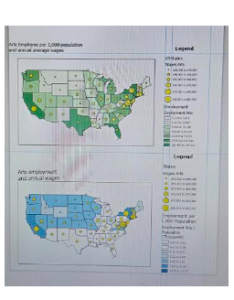
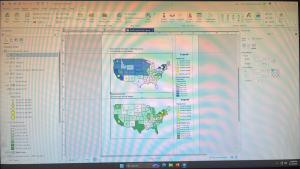
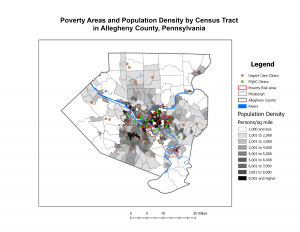
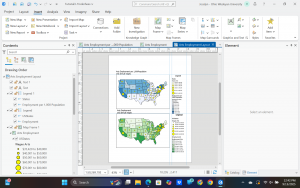
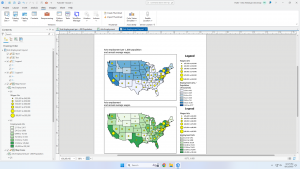
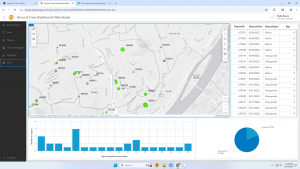
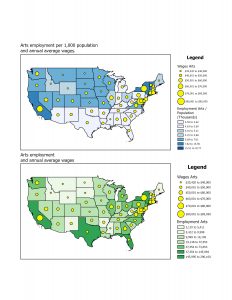
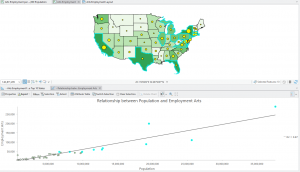
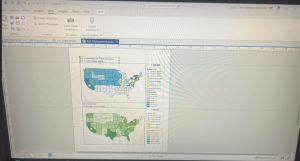
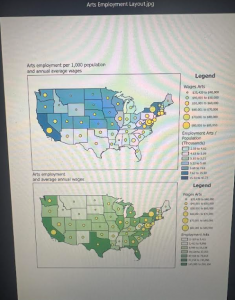
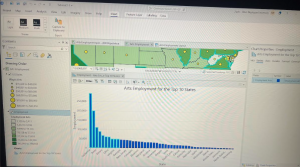
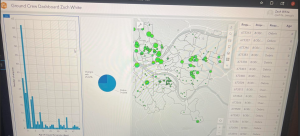
I included a few screenshots for chapter 3 work. The first screenshot is through ArcGIS Pro whereas the second screenshot is a bit better as the exported file I did for the first your turn exercise in the 3-1 tutorial. I think that formulating and formatting these map layouts and charts is super useful for communicating projects/research with a representative audience. We can make graphs through the data category when you select a content layer. Sometimes the people we interact with and use these maps to communicate to are not as exposed to technology or GIS data. I think that ArcGIS storymaps and dashboard is a great way to combine and show interactive maps and visualizations. We can do this by going to our account profile on webGIS. I think that these methods can provide a great depth of insights, thus expressing a greater level of widescale meaningfulness with this type of GIS work. I learned a lot from the building layouts section and I think this is a fundamental part in this chapter three material. If the layout isn’t built correctly, then the map can’t be communicated or transferred correctly, and then it can struggle to be engaged or interacted with. I will refer to this section because while I learned the basics, there are many details to adding maps to layouts and everything that goes into that. The final two screenshots are of a bar chart I created for employment arts and finally my dashboard.
Notes of very minor troubles along the way for Chapters 1, 2, and 3
- A side note for an issue I came across is that I have been fine and able to open new projects and retrieve the data for them for each subsection of the tutorials, but I have to manually do it by opening finder on my computer and then clicking on whatever name and from there it opens up ArcGIS pro. The point being that I haven’t figured out how to do this through directly opening a new project at the top left of ArcGIS pro and doing the browsing method from there. I don’t think this will be a big issue because I am still able to easily get the data but just something I wanted to record in these notes.
- Something similar I came across when trying to name and rename projects. There are duplicates I think and I’m sure there is a way to edit the name of a project when the project is opened up I just can’t seem to find it.
- I was unable to do step 2 of Extrude a 3D choropleth map section of tutorial 2-4. I think this was a very minor step and didn’t really have an affect on what I was doing at large.
- I couldn’t get my histogram to change for step 9 of the Create a choropleth map with normalized population and custom scale section of tutorial 2-6. I had no problem with the histogram in step 4.
- In tutorial 2-8, for step 5 of the set visibility ranges for labels section, I was unable to find an “Out Beyond” button or marker in the visibility range group under labeling. The goal was to have the visibility range be that of the current range of the west village part of NYC, and so I was still able to show that by putting the max. and min. scale markers as <current.> When I would zoom out and in to see labels and or boundaries appear and disappear based on the current bookmark range, they would go away when I would zoom out but not come back when I would zoom in. However, after zooming out, I would click whatever bookmark I was working with to zoom back in that way and everything would show again.
- I was unable to do steps 4 and 5 for the add interactions to the dashboard section of tutorial 3-4. My dashboard looks good but I can’t find where to expand one of the elements to cover the full screen.