Huntington Week 6

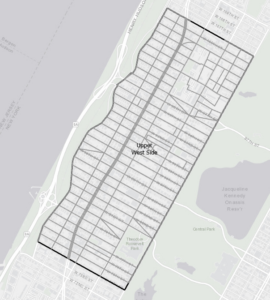
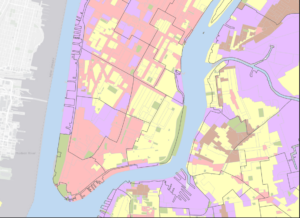
9-1: Short tutorial on the use of buffer rings, useful for finding low-service areas.

9-2: A continuation of 9-1 that teaches you how to make multi-ring buffers.

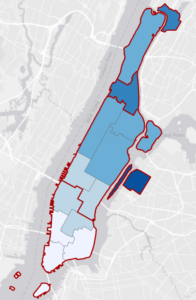
9-3:  Multiring buffers for calculating gravity models to do things like calculate travel times to service areas.

9-4: I’m really wishing I had finished this before I did my final oops. Network analyst tools are an excellent tool to determine and analyze service areas.

9-5: Not working.

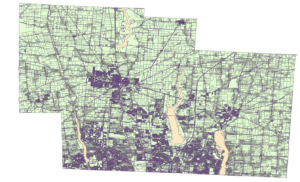
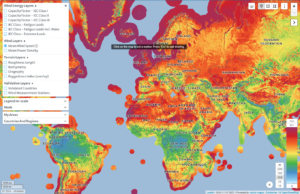
10-1: Learned how to work with raster datasets, including  extracting smaller datasets and making elevation maps.

10-2: Learning how to make heat maps using thresholds.

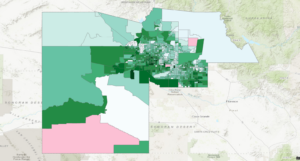
10-3: Making risk index models using geoprocessing

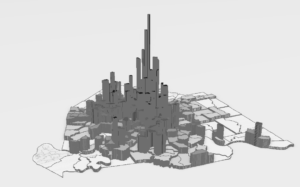
11-1: Cool 3d maps, learned how to move around the scene and change the basemap.

11-2: Learned how to create a local scene and make 3d vector data models called TIN surfaces.

11-3: Learned how to make 3d feature classes by Z-enabling them and edit 3d display settings.

11-4: Learned how to determine LOS and a whole bunch of distance data in 3d maps.

11-5: Learned how to edit various visual aspects of 3d models.

11-6: Learned about procedural methods for creating 3d models and using different texture styles.

11-7: Learning how to make an actual animation in GIS which is crazy. This is all stuff I know how to do from being an animation major and its very similar.


Huntington Week 7

Address Point: Data of all the registered building addresses in Delaware county

Annexations: All annexations on Delaware county’s border from 1853 onwards

Building Outline: The physical outlines of all the buildings in the county

Condo: locations of all condo complexes in the county

Dedicated ROW: All Right-of-way locations in Delaware county

Delaware County Contours: 2 foot elevation map

Farm Lot: All the farm lots in the county

GPS: All the GPS monuments in the county

Hydrology: all the major waterways

MSAG: All 28 different townships in Delaware county

Map sheet: All the maps of the county

Municipality: All the municipalities

Original Township: the original boundaries of the towns

PLSS: Public land divisions in Delaware county

Parcel: All cadastral parcel lines

precinct: All voting precincts

Recorded document: The location of all official documents recorded in the county

School District: map of all the school districts

Street Centerline: Roadmap of Delaware county

subdivision: all the condos and divided housing

Survey: land survey

Tax district: tax districts

Township: More townships

Zipcode: All the zipcodes in the county

Week 5 Huntington

4.1  In this tutorial I learned how to set up a GIS project and create folder connections. I also learned how to convert outdated filetypes into ones used by modern GIS, import data tables, and modify geodatabases.

4.2  I learned how to sort information a whole bunch of different ways in attribute tables. I can add new fields, calculate them using values from other fields, sort them, remove them.

4.3 was corrupted, even after redownloading.

4.4 This was a very short tutorial about creating spatial joins.

4.5 Another very short tutorial about creating central points for polygons and making point layers.

4.6 Another short tutorial about creating a new table to join new information to existing data.

5.1 Now I know how to change the coordinate projection method on a global scale.

5.2  Now I know how to change the coordinate projection method on a continental scale, these really could have been 1 tutorial.

5.3 Learned how to find and set a coordinate projection for a smaller local system

5.4 Learned about X,Y format for coordinates, how to integrate it into a map, and how to convert more file types into feature classes.

5.5 This tutorial isn’t working

5.6 Same for this one

6.1 Learned how to use the pairwise dissolve tool create new groupings.

6.2 Learned how to use the pairwise clip tool to cleanly select an area.

6.3 This tutorial isn’t working

6.4 Short tutorial, learned to append features onto different datasets.

6.5 Learned how to use the pairwise intersect tool.

6.6 Learned how to use the Union tool to combine feature classes.

6.7 Learned how to apportion data from two feature classes using the Tabulate Intersection Tool.

7.1 Learned how to manipulate and edit polygons. Making all the buildings line up was very satisfying.

7.2 Learned how to create my own polygons, also very satisfying.

7.3 Broken.

7.4 Also Broken.

Huntington Week 4

1.1 This was a good tutorial and I was glad to discover arcGIS is very similar to other programs I’ve used in terms of basic navigation and UI design, so it all felt pretty familiar.

1.2 Standard stuff, moving around the map, making different layers visible at different levels, pop-up windows and some very basic SQL.

1.3 More in depth info about using and manipulating attribute tables, fields of view for attribute data, and using the Statistics tool.

1.4 Symbols are fun! Learned how to change symbols and colors with the symbol window. Learned how to alter labels and add feature classes to the map. 3D maps are so cool. I love this.


2.1 Changing symbol colors, outlines etc. Learned how to change feature colors using unique values to make maps easier to understand.

2.2 Learned how to change label properties, use the conflict resolution tool to prevent overlaps, and edit/ remove pop-up windows for each layer.

2.3 Learned how to make a sub selection of data in a feature layer using SQL and changed the symbology to be more legible.

2.4 Was corrupted, did not work.

2.5  Learned how to analyze data to create symbology that displays the overlap between 2 sets of data.

2.6 Learned how to make normalized population maps and show multiple overlapping layers without turning one off.

2.7 Learned how to create a dot density map and alter the dot size and characteristics.

2.8 Learned how to set the visibility for different zoom levels on individual layers.

3.1 All of the chapter 3 files were corrupted except for 3.3 which was missing. Redownloading the files did not fix this.

Huntington Week 2

Chapter 1: Chapter one is a basic overview of the various ways to sort, analyze, and display information in GIS software. It covered the process of selecting and understanding your data, as well as all the ways to manipulate and display said data. I found the different “types of features” particularly interesting because they made intuitive sense to me and it was cool to see the different ways various types of data can be displayed. I was already vaguely familiar with the concept of vector and raster images, having used a number of different digital art programs, but it was interesting to see how that difference was represented in the much more analytical GIS software. I understand the concepts behind the various types of Geographic attributes, but I don’t fully comprehend all the ways in which these can be combined to produce different results. Presumably understanding will come with practice and experience, and I look forward to that. I worry that I will not remember all the different ways data tables can be used, as there are quite a few specific functions listed in the chapter. I understand the theory behind each of the various operations but I am sure that I will not remember them well enough to apply them to GIS without further study.

Chapter 2: Chapter two is about the process of mapping itself. It covers the basics of how to prepare the data and create the map, as well as various tips and strategies you can use to make your maps easier to understand. The chapter discussed the various uses of highly detailed maps vs more general ones. The chapter explained how unnecessarily over-detailed maps can in fact reduce clarity and make the map harder to understand, so in situations where granularity is not needed, it is best avoided. The explanation Geographic coordinates and how GIS uses them was clear and understandable, as well as the demonstration of using various types and categories to display different related types of information. What I most appreciated about this chapter was the advice it gave on how to create good maps. Advice about how detailed and granular to make the map, how many categories to include, how large of an area to cover etc. was all very helpful and interesting to learn about.

Chapter 3: I was initially confused about the concept of “the most and least” but the book did an excellent job of explaining it. The term itself was kind of confusing but I understand it now as simply including quantity in the analysis process, which makes a lot of sense and I can think of many ways that might be helpful. Additionally its use in summarizing data to be more easily understandable at a glance is also very helpful in the creation of usable maps. The various uses for counts, amounts, and ratios are now also clearer to me, as is the use of classes to simplify maps into more easily understandable divisions. Yet again it comes down to a question of granularity. In some cases, individual values may be necessary to provide detailed information for precise areas, but for other situations like public discussion or presentation, that kind of granularity is unhelpful and confusing. The standard classification schemes and their various uses are also a very helpful tool to know about. The section about choosing a classification scheme is particularly helpful in this regard and likely something I will refer back to many times during the course.

Huntington Week 1

Hi, my name is Max Huntington. I am a sophomore transfer student from Massachusetts. I am an environmental science major and I spend like to spend my free time reading or playing video games. I have never used GIS before but I am excited to learn.

This chapter was an interesting introduction to GIS and its history throughout the late 20th century.  It is interesting that so many geographers have mixed feelings about GIS, but I suppose it makes sense in context. I was also completely unaware of the insane reach and scale of GIS in the modern world, the many ways in which it has affected my life are crazy to think about. All the different ways GIS can be used makes me glad I am taking this course, as the software is so broadly applicable that it will be helpful regardless of the field I end up going into. I am not entirely sure what the difference between spatial analysis and mapping is, but I gather it is related to the type and amount of information that can be extracted from the process. It is also interesting to see the threads of convergent development in the 50s and 60s across multiple countries and fields arriving at similar software solutions. I hadn’t heard of the concept of “black boxes” in that sense, but it is strange to think about just how many things in our lives operate in this manner. The average person (me included) does not understand the methods by which many things happen, but we accept them as fact nonetheless.

The National Weather Service has a fascinating online GIS portal that can display all sorts of weather and climate related data, from forecasts and advisories, to flood risk assessments and and satellite imagery for the entire country.


Another interesting application I found was the “Global Wind Atlas” used to determine the efficiency of wind power in various locations by the energy industry. It was created so professionals could determine optimal locations for wind power all over the world.