My name is Halle Kozak. I am a senior and I’m studying zoology and botany. I’m from a small town in central New Hampshire.
I took the quiz and read the assigned text which introduced what GIS is and how it can be used in different ways. I found it interesting how many different uses of GIS there are and how similar processes are used to explore so many different problems. One thing I found helpful in this text as someone who is unfamiliar with GIS was the distinction between spatial analysis and mapping. I learned that spatial analysis generates more information that can be taken from maps alone while mapping is a representation of geographical data in a visual form. It was found that the success of GIS is credited to a combination of social and technological developments. GIScientists have complex jobs that reach further than just data analysis. Some of their jobs include, figuring out how spatial objects become digital entities and showing how to model different relationships within spatial analysis. It is also important for GIScietists to manipulate data in order to ensure that GIS visualization is consistent with the human capacity for visualization. I thought this was really interesting to read about because it helps to explain the complexity behind the human aspect of GIS analysis. When it comes to computational science, sometimes the prep work and behind the scenes can go overlooked when people are only expecting results so I liked that this included the human side of things. I think it is interesting to understand the differences and relationships between GIScience and GISystems. GISystems are the processing aspect of GIS and incorporate classification, digital encoding, spatial analysis, and output into software while GIScience covers the theoretical bases and justification for the way that these processes are executed. Essentially, GISystems are what it does and how it works, and GIScience is why it does what it does. It was interesting to read about the real life example of John Snow’s work on the relation of Cholera and use of public water wells in London and how he was able to prove the spread of cholera related to water pumps. Overall I think this chapter provides good background knowledge and a strong foundation for learning the ins and outs of GIS during this class.
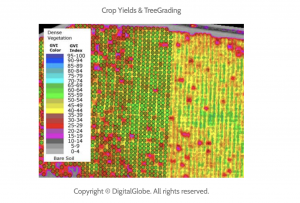
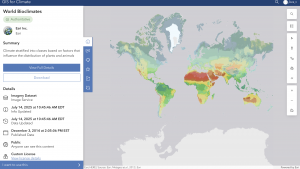
One GIS application I looked into was a spatial evaluation of forest biomass in Yasuhara, Japan. This map shows quantities of material in different areas of forest aged for 40 years. It is related to biomass usage and the thinning of forests due to lack of cultivation.
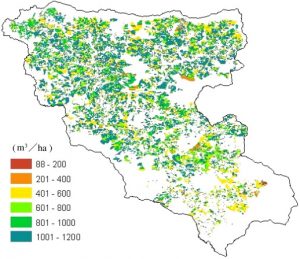
Kinoshita, T., Inoue, K., Iwao, K., Kagemoto, H., & Yamagata, Y. (2009). A spatial evaluation of forest biomass usage using GIS. Applied Energy, 86(1), 1-8.
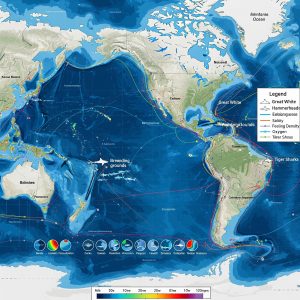
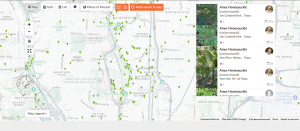
Another application I looked into was the evaluation of Forest fire risk and the use of fire towers for monitoring. This map shows the visibility of the forest area from the Bereket Tower in Kahramanmaras, Turkey. It highlights the lack of coverage for a large area of forest that is at risk for forest fire. I find this application especially interesting as I like learning about forest fire prevention.
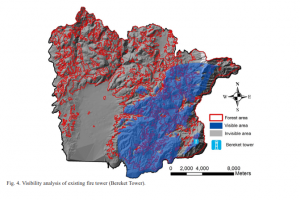
Sivrikaya, N. U. R. İ., Saglam, B., Akay, A., & Bozali, N. (2014). Evaluation of forest fire risk with GIS. Polish Journal of Environmental Studies, 23.