Kelner Week 6
Chapter 9:
This chapter went pretty well aside from some bumps here and there. I struggled to find stuff occasionally but other than that it was good.
Chapter 10:
Like chapter 9, this one was smooth as well.

Chapter 11:
I struggled a bit with this chapter but all in all it went decent. Usually it was me struggling to find something or I just couldn’t figure something out so I moved on. The chapter was mildly annoying but it shows some pretty cool ways to show data.

Norman Week 6
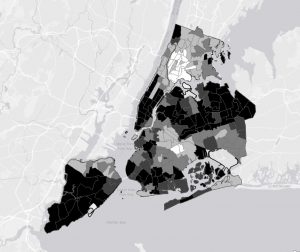
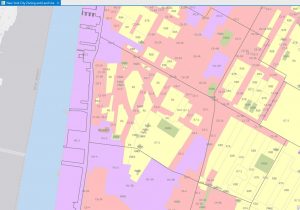
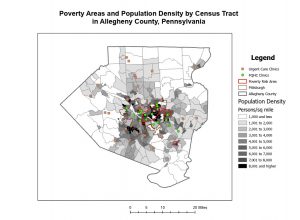
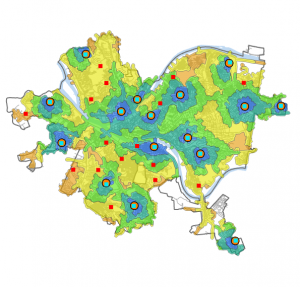
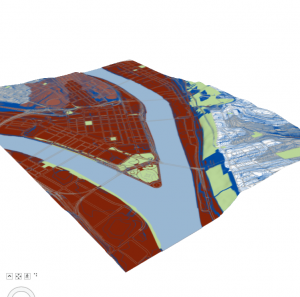
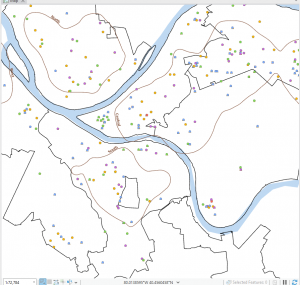
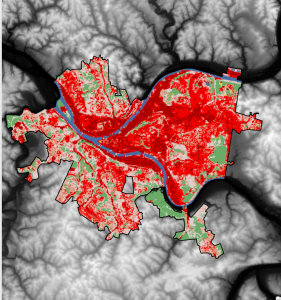
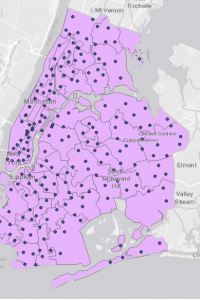
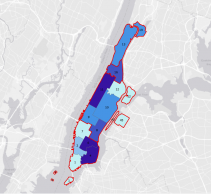
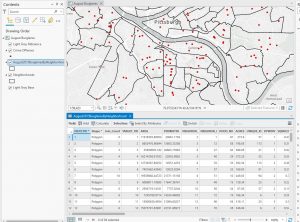
Chapters 9 and 10 went fairly smoothly for me. Definitely more complicated than the previous chapters, but I also found it to be very interesting and helpful. I ran into a few issues with the Chapter 11 tutorials, but if it took too long trying to figure things out, I would move on and it went pretty well. I liked that these chapters showed more intricate ways to represent and symbolize data. These are the kind of maps you see a lot, so it was cool to be able to make them myself and see how much I had improved with the intricacies and details of the software. Attached are screenshots of a few of my tutorials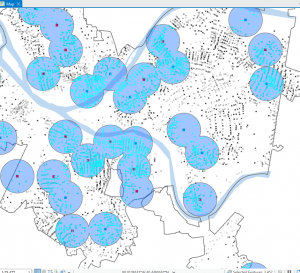
Kelner Week 5
Chapter 4:
This chapter went pretty well and I didn’t really run into any issues. If I ran into a roadblock I sorted it out pretty quick.

Chapter 5:
I struggled a fair bit with this chapter. I had trouble with my data and with adding it into ArcGIS. I had some mapping and software issues as well, like for example I wasn’t able to find the Display XY Data button. All in all this chapter put me through the ringer and I’m glad I was at least able to get bits and pieces done for it.
Chapter 6:
This was a much better chapter compared to 5. Honestly it went smoothly and I had the same issues as I did in 4 of just struggling to find stuff.
Chapter 7:
Again, the chapter went smooth and really enjoyed playing around with the polygons.
Chapter 8:
Very straight forward and easy. I finished this chapter up fairly quick.
Deal Week 7-8
Final
I chose to do option 1. Selecting and Classifying Land Uses for my first half of the final. I first created a map and inserted the data file. Then I opened the attribute table of the Parcel layer and used the select by attributes tool to create queries of all of the different land uses. I used the provided land use codes to select each section and then used the create new layer with selected attributes button to create a new layer for each of the land uses. I created 5 separate layers of land use, as Delaware does not have any land that fits the mineral land use classification. I then color coded these layers. I then did the same process to map agricultural uses. Excluding Tobacco and vegetable farms, as well as greenhouse farms as we do not have these in Delaware.


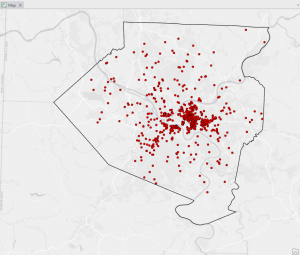
For my second option I chose to do 2. Making New Shape Files from Existing Shape Files. I decided I would make a map showing the proximity of roads to different land use types. I did this by finding and imputing a data set that showed all of the roads in Delaware, I then used the same Parcel data set from selecting and classifying land uses, and went through the same process. I opened the attribute table of the Parcel layer and used the select by attributes tool to create queries of all of the different land uses. I used the provided land use codes to select each section and then used the create new layer with selected attributes button to create a new layer for each of the land uses. I believe this map could be useful for land use planning. Land use planning often involves analyzing the proximity of development to roads and infrastructure. Selecting specific types of land use near major roads can help assess urban sprawl or development impacts. Urban planners could use this map to assess land development patterns and ensure sustainable growth or identify areas where development could cause traffic congestion. To make the map a little more clear I also added in a hydrology layer to delineate where waterways are present between the roads.

Kelner Week 2
Chapter 1:
GIS is a “process for looking at geographic patterns in your data and at relationships between features”. When utilizing GIS lots of information has to be taken into account, and depending on what information is present leads to different routes to form your map or data. Next, choose a method for processing the data and analyzing the results. Features can be classified as discrete or continuous, and they can also be summarized by area. Discrete features (such as specific locations) can be pinpointed, while continuous phenomena (like temperature) can be measured at any location since every spot has a temperature. Continuous data is typically derived from a set of discrete points, and summarized data represents counts or densities of features within defined areas, like the number of households in a county. Geographic features can be represented as vectors or rasters. Vector features are represented as rows in a table with defined x and y coordinates, making them ideal for discrete data. In contrast, rasters use a grid of cells to represent features in continuous space, making them suitable for continuous numeric values. While rasters can depict continuous categories, they can also combine discrete features with other layers. Categories help organize and make sense of your data, while ranks create a relative order among features. Counts indicate the total number of features visible on a map, while amounts refer to any measurable quantity associated with those features. Ratios show the relationship between two quantities by dividing one by the other for each feature, and proportions indicate what portion of a total each value represents. Finally, densities provide insights into how features or values are distributed per unit area.
Chapter 2:
The beginning of the chapter stresses the significance of analyzing patterns among various features on a map. It illustrates how police utilize GIS to monitor crime and decide where to deploy patrols. The selection of features to display and their representation is guided by the information required and the map’s intended purpose. Before creating your map, it’s crucial to assign geographic coordinates to the features you want to include, a process mainly handled by the GIS. An optional step prior to mapping involves assigning category attributes with values to each feature. For single-type features, you can represent them all with the same symbol. The chapter notes that GIS records each feature’s location as pairs of geographic coordinates or sets of coordinates that define its shape, whether it’s a line or an area. Using a subset of features can help reveal patterns that might be obscured when mapping all at once. Mapping by category, with distinct symbols for each, can improve your understanding of how a location functions. Additionally, organizing features by type can uncover different patterns, as features may belong to multiple categories. Sometimes, creating separate maps for each category is beneficial if features are too close together, making them hard to distinguish. When mapping multiple categories, it’s best to limit the number to seven on a single map. The number of categories that can be effectively displayed may also vary based on the map’s scale and the features involved. If you have more than seven categories, consider grouping them to enhance pattern visibility. Including recognizable landmarks—such as major roads, political boundaries, towns or cities, and significant rivers—can greatly assist viewers in interpreting the map.
Chapter 3:
Kelner Week 3
Chapter 4:
This chapter concentrated on mapping density, which illustrates varying concentrations of specific features and helps reveal patterns in the data. It can be applied in contexts like census maps and the frequency of robberies per square mile. GIS is a valuable tool for visualizing the density of certain points or lines, typically represented through a density surface. Density maps can be created based on the number of occurrences of a feature within a defined area or the values related to that feature. There are two main methods for generating density maps: using defined areas or creating a density surface. The first method, which focuses on defined areas, is more graphical and often employs dot maps. In a dot map, the proximity of the dots indicates the density of that feature in a specific location. To calculate the density value for each area, you divide the total number of features (or their overall value) by the area of the polygon. The second method involves creating a density surface, typically as a raster layer in GIS. Each area is assigned a density value based on the number of features within a certain radius. While this approach requires more effort, it offers greater detail than the first method, displaying the locations of features and continuous phenomena. Personally, I prefer the defined area method because it results in clearer and more understandable maps. The cell size in either mapping approach significantly influences the observed patterns; if the cell size is incorrect, the resulting patterns can vary, which can remind one of gerrymandering. To determine the cell size, you convert the density units to cell units, divide by the number of cells, and then take the square root to find the size of one side of the cell. Overall, I found this chapter fascinating. There’s much more complexity to density maps than I initially realized. I’ll likely need a textbook handy when I start working with the program this year, as there’s a lot to absorb.
Chapter 5:
This chapter explores the “Finding What’s Inside” technique, a flexible tool for mapping areas to deepen understanding of their dynamics. It also facilitates comparisons between different regions, making it a valuable resource. The first method involves overlaying a boundary on the area’s features. The second method selects features located within this boundary, while the third combines these two approaches to produce summary data. This technique can uncover patterns within a specific area or across multiple regions. Categories can be either discrete or continuous, with continuous data potentially coming from earlier GIS maps. Area graphs can help determine whether a particular feature is present within an area, compile a comprehensive list of features in that area, or count the number of features in a specified region or set of regions. Since some linear or discrete data may extend both inside and outside an area, you can choose to include only data that is fully contained, completely outside, partially inside but extending beyond the area, or just the portions that are within the area. The first approach to “finding what’s inside” involves drawing boundaries over features. The next method selects features within a designated area, and another option overlays both areas and features. Different methods are more effective for different problem-solving contexts. When creating these maps, using bold lines or shading to define areas can enhance clarity. After developing these maps, statistical analysis can provide valuable insights into the data and highlight visual patterns. The chapter also outlines how to create various types of maps and the associated steps involved.
Chapter 6:
Mapping the area around a feature can be advantageous in numerous ways, such as estimating travel time from home to a store or tracking logging activities near a river or property line. The concept of “nearby” can be interpreted in different ways. For example, it could refer to a specific distance, like identifying all trees of a particular species within a mile of a river, or it might involve travel routes, such as how quickly a fire truck can reach a fire. When assessing proximity, measurement units can include more than just distance; considerations like time, cost, and effort are also significant. It’s also essential to decide whether to factor in the Earth’s curvature when calculating distances. There are three main methods for determining what’s nearby: straight-line distance, distance or cost over a network, and cost over a surface. While I’ve already discussed the first two, I’ll explain cost over a surface. This approach is especially useful for assessing travel costs over long distances, as it employs a raster surface to represent the costs associated with moving away from a feature across the map. Additionally, GIS allows you to select features within a given distance. By entering a distance from a source, it highlights all features within that range and provides a list, count, or summary of those features without the need for a defined boundary. However, when dealing with multiple sources, it’s crucial to label each feature to indicate which ones are near each source. Fortunately, GIS comes equipped with a built-in street network, so you don’t have to input any extra data when measuring distances or costs over a network.
Godsey Final (Week 7-8)
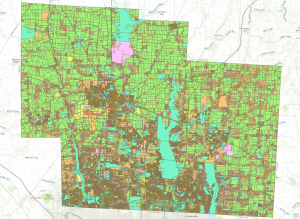
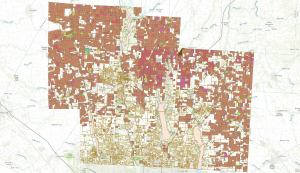
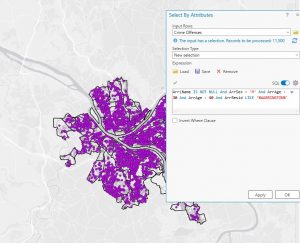
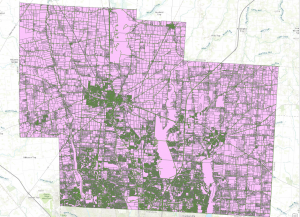
For the final in GIS 291: Geospatial Analysis with Desktop GIS, I began by downloading datasets (Parcel, Street Centerline, and Hydrology) from the Delaware County Ohio GIS Data Hub and opened up the maps in the GIS program. The first application I decided to do was Selecting and Classifying Land Uses. The first step was to open up the attribution table for the Parcel layer; this displays all of the data regarding land use in the format of Delaware County Land Use Codes. These codes include agricultural (100-199), industrial (300-399), commercial (400-499), residential (500-599), and exempt (600-699). Mineral (200-299) is usually a land use code, but the Delaware County area does not have any mineral resource parcels. The next step was to take all 5 of these land use codes and separate them into new layers to highlight the different land uses within Delaware County. I did this within the Parcel attribution table with the tool Select by Attributes; within this popup, I created the query “Class is greater than or equal to 100 and Class is less than or equal to 199” (this example is for agricultural land use). The query highlights all data points with a class code within 100-199, which in turn selects all of the land being used for agriculture on the map. Then, I right-clicked on the Parcel layer, and then under selection, I clicked Create a new layer from selection, which made a new layer in the contents column, which I then renamed to agriculture and selected an appropriate color for. Next, I repeated that process for the 4 other land use codes. The following colors match each of the 5 land uses; green (agricultural), yellow (industrial), teal (commerical), orange (residential), and red (exempt). For the second half of this application, I used the same process of selecting the data and creating new layers to highlight the different agricultural land uses within Delaware County. The 9 other land uses and their corresponding colors include; red (vacant land), orange (cash grain/gen farm), yellow (livestock), green (dairy farms), teal (poultry farms), blue (fruit/nut farm), purple (nurseries), brown (timber), pink (other). The agricultural land uses not included because they do not exist within Delaware County are vegetable, tobacco, and greenhouse farms.
Map of Land Uses:
Map of Agricultural Uses:
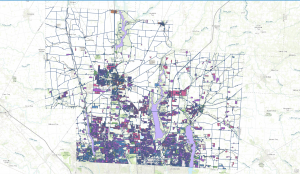
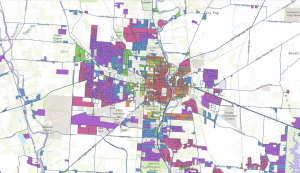
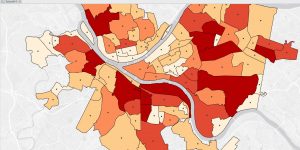
The second application I decided to do was Mapping Change. I began by downloading the Subdivision file from the Delaware County Ohio GIS Data Hub. Then, in the GIS program, I opened the following layers on my map: Parcel, Street Centerline, Hydrology, and Subdivision. First, I opened the attribution table for the Subdivision layer and located the column with the dates of the subdivision’s establishment; these dates range from 18080311 (3/11/1808) to 20240917 (9/17/2024). The next step was to separate these establishment dates into new layers to highlight the changes in urban development within Delaware County. I did this within the Subdivision attribution table with the tool Select by Attributes; within this popup, I created the query “Date is greater than or equal to 18080311 and Date is less than or equal to 18501231” (this example ranges from 3/11/1808 to 12/31/1850). The query highlights all subdivision establishments within 1808-1850, which in turn selects all of the subdivisions established during that time period on the map. Then, I right-clicked on the Subdivision layer, and then under selection, I clicked Create a new layer from selection, which made a new layer in the contents column, which I then renamed to 1808-1850 and selected an appropriate color for. I repeated that process for the dates 1851-1900, 1901-1930, 1931-1960, 1961-1990, 1991-2010, and 2011-2024. The following colors match each of the date ranges on the map: red (1808-1850), orange (1851-1900), yellow (1901-1930), green (1931-1960), blue (1961-1990), purple (1991-2010), pink (2011-2024). I also included a close-up of downtown Delaware because I think the changes in the establishment have been more noticeable throughout the decades (also, it’s cool!).
Map of Establishment:
Downtown:
Norman Week 5
Chapter 4 was about file geodatabases and this went pretty smoothly for me with the attributes and such. I attached some screenshots of my work from this chapter. Chapter 5 was more difficult. I ran into some issues with the data I had downloaded because it was different than the book said and I couldn’t find the columns I was looking for to do some of the tutorials. I’m not sure what happened. But after reading the chapter and tutorials, I think that if my data was represented in the way it was in the book, I would have been able to do this easily, so I get the concept. Chapter 6 was mostly fine, I found it interesting. Chapter 7 was super fun actually I liked the polygons! Chapter 8 was also pretty smooth. No big issues to report. I have attached some work from the tutorials as well as my Delaware data in ArcGIS
.
Norman Week 4
I did not have any crazy issues with the tutorials in Chapter 1. This was mostly just introducing to the software itself and finding basics of where things are. It seems really fun and fairly easy to use just from this introduction. I didn’t run into any issues with Chapter 2 either. I really liked chapter 2 with the map design aspects and showing different ways to display data to best symbolize the point you are trying to get across. I had a few more issues with chapter 3; it was not directly related to mapping, but more finding data and sharing the maps. I didn’t have problems with the charts, but sharing was a little tougher. Here are my maps from Tutorial 1-1, Tutorial 2-2, and Tutorial 2-6.