Chapter 7: In the first tutorial I was able to manipulate the polygons within a campus map, using the editing features. This was helpful because I had not yet used the editing frames, and I had to make sure to be saving each edit after I made it. Tutorial 2, went more in depth with the features used to create and manipulate polygons within maps. I was able to create my own polygons and get a better understanding of the types of polygons that are useful in this kind of mapping. Tutorial 3 taught me how to smooth layers, it was helpful because I was able to still see the underlying mapped features but have a translucent marker over top to designate the boundaries of the noted features. I hit a snag with the fourth tutorial because gis for some ridiculous reason would not allow me to select the polygon layer which therefore meant I could not finish the tutorial because I could not manipulate the layer in any way but it was interesting to learn about how to import this layer of polygons into an existing map, and I hope in the future GIS will work properly so I can get the polygon to layer over map properly.
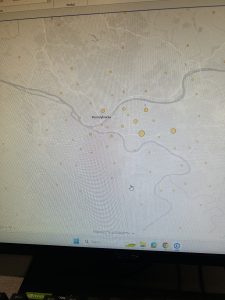
Chapter 8: The first tutorial helped me plot a large data set on the map, then I was able to make sure every data point was properly matched. This is helpful because in most cases when a vast data set is being placed in a mapping system there is bound to be mistakes or mix ups but learning how to find and correct those within GIS is important to making sure I know how to properly create and use the mapping I am learning. I was also able to use the collect events feature to quickly create a map that visually shows the frequency of events relative to location on the map. This was significantly faster than other methods the tutorials have used in the past to create maps like this. I continued this work in Tutorial 2, where I was able to again use the attribute table to determine the incomplete data in the set. I was also able to use street addresses for attendees and put them on a map which clearly has a cluster in the center, which is useful to know for the organizers of this hypothetical event, and is how these skills can be applied to the real world.
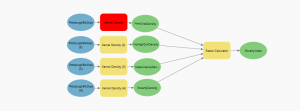
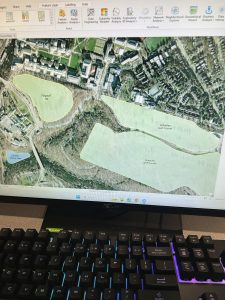
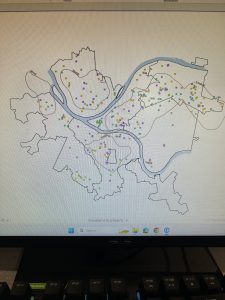
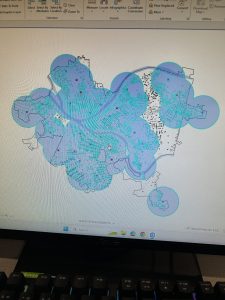
Chapter 9: From the first tutorial I learned how to create buffers and have the mapping system count other mapped features within those buffers. I was able to count how many kids were living within certain distances from a pool, and this could be repeated in many applications, it would be useful to many types of research that might actually be done. The second tutorial expanded on this by teaching me how to obtain more statistics from within these buffer areas which is helpful for more complete data analysis. The third tutorial helped me determine which pools were open, and made a map based on the proximity of the commute to an open pool. It also helped me use the data from this map to count the number of pool tag holders in these regions. This is more data analysis that is helpful for real world applications, not just with pools but with any resource, and can even be applied to animal populations. Tutorial 4 taught me how to use the data and demand tools to determine which pools maximize attendance, this is also an interesting concept to use for real world applications. Tutorial 5 taught me how to create clusters of data points, differentiate their statistics, and create separate labels and map symbols for those groups.
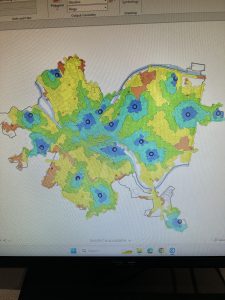
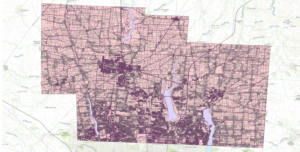
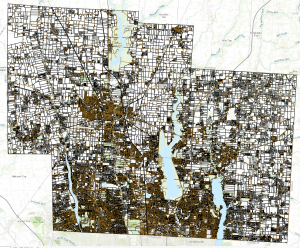
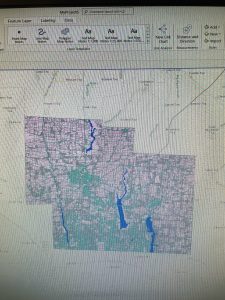
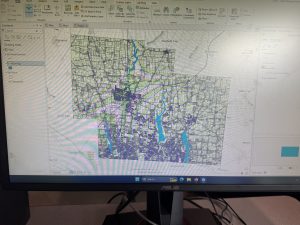
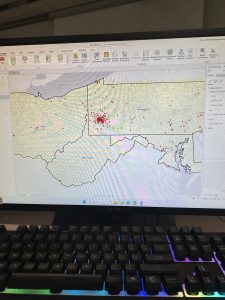
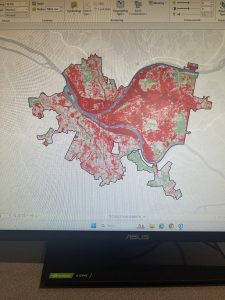
Chapter 10: Tutorial 1 was informative, it taught me how to use, manipulate, and extract the raster data from the mapping system. This helped me to visualize data sets and to integrate two different raster layers by changing the transparency of a layer. This will be helpful in the future when trying to create a multifaceted map that can display more than one type of data/information at the same time. In tutorial 2, I used some of the same skills as well as many I learned previously in order to create a density/heat map which was very interesting. Previously each of the skills that was used here had been used in a different capacity but bringing them all together to create this map really helped me to see the usefulness of some of the skills I have learned in earlier chapters of this course. Tutorial 3 was an even more immersive use of these skills bringing together what was learned in tutorial 2 with more of my past skills and it really made me feel good to make this map almost completely on my own.
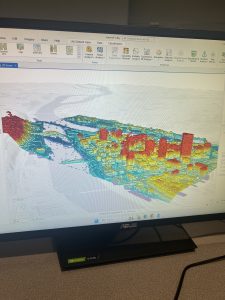
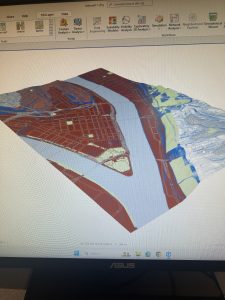
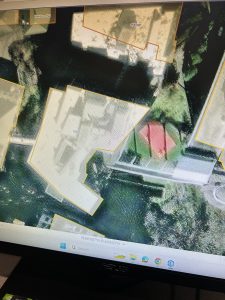
Chapter 11: Tutorial 1 really helped me to get oriented in the 3D global view of the mapping interface, with a brief overview of shortcuts and how to manipulate the view point and manipulate the base layers. Tutorial 2 helped me learn to create a TIN layer and my own local view of the 3D map of Pittsburgh, which made the use of a 3D map make a little bit more sense. Tutorial 3 taught me how to add and enable and turn off z-enabled features to my 3D map which was interesting, and I know it will eventually come in handy for something other than trees in a park. Tutorial 4 got more in depth into the practical uses and functions of the 3D mapping interface. It brought in the Raster skills learned last chapter and used them in a 3D map this time. I learned how to manipulate a lot of the different features of the 3D map and use various different types of data to get different views. Both the fifth and sixth tutorials centered around using the 3D interface to add three dimensional shapes (buildings) onto the map in progressive detail. And finally, in tutorial 7 it culminated into a 3D animation which I think will be less useful to me in the future as it would be to someone in more of a city planning or architectural career path.