Chapter 4:
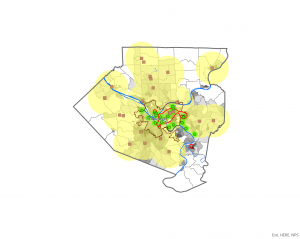
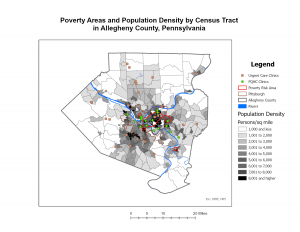
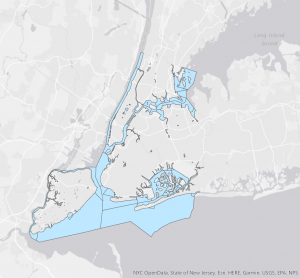
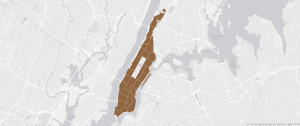
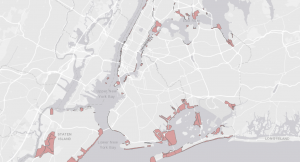
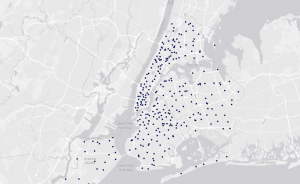
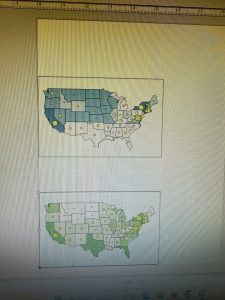
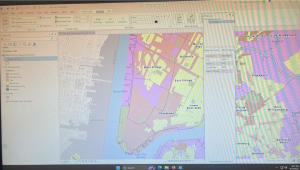
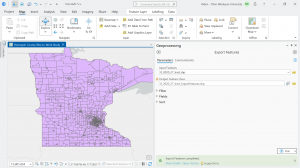
Chapter 4 went over how to convert data into geodatabases, along with modifying attribute tables and fields and using SQL query criteria to search and narrow in on certain types of crimes. There was also one section that taught how to make a centroid have a central point which you could in turn relate it to a specific value and specific size based on that value to visually show what area has a certain higher rate of the value.
Chapter 5:
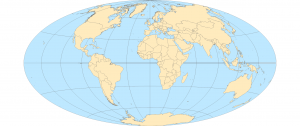
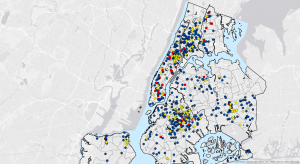
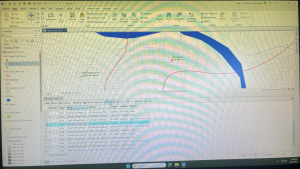
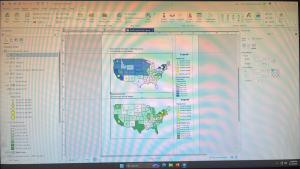
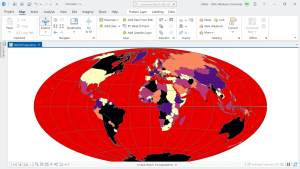
Chapter 5 went over creating a world map projection, setting up a coordinated system and downloading data and creating a spatial map of it. A lot of this chapter dealt with the coordinate systems from properties tab and tools.
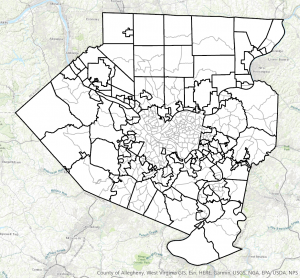
Chapter 6:
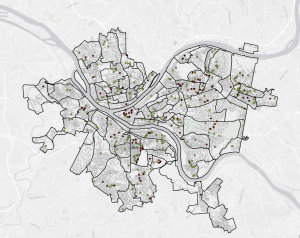
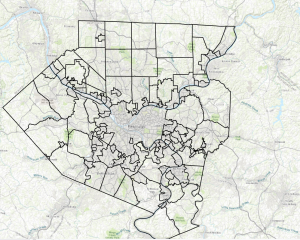
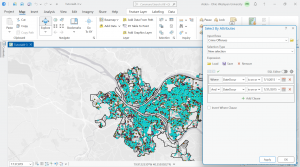
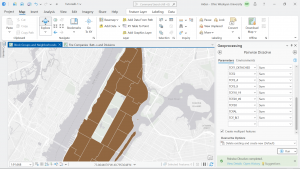
Chapter 6 went over dissolving block types of polygons to create neighborhoods, extracting neighborhoods using attributes to study an area, merging features, and intersecting streets and fire companies to look at various data for fire companies.
Delaware Data Inventory & Final Exam:
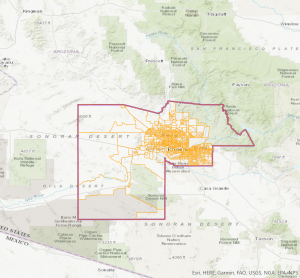
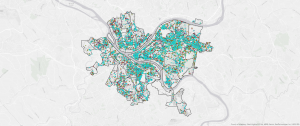
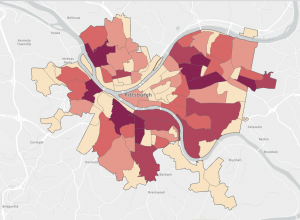
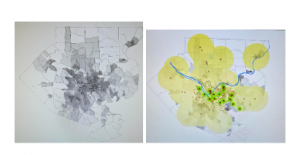
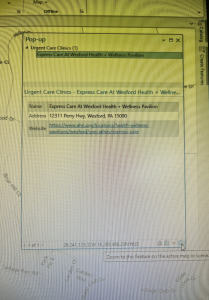
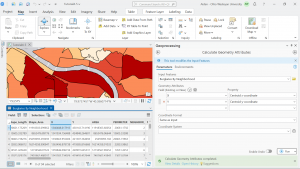
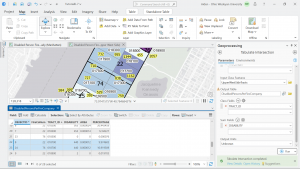
Looking at some of the data layers, it looks like there are ones for zip code, streets, GPS monuments and many more. These layers are sorted into 6 Data categories; Land data (physical features as data layers), DXF Files (Addresses, streets, etc..), Transportation (Layer concerning transportation like railroads), All Files (Everything available), Election Data (Precincts), Imagery (Satellite imagery of Delaware county)
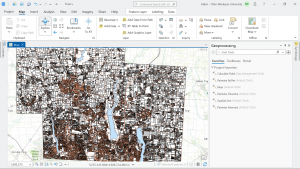
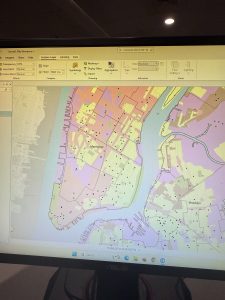
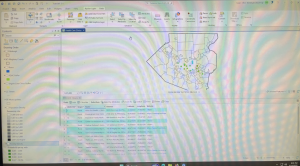
(Really blurry for some reason, but contains Parcels, Hydrology, and Street Center Lines of Delaware)