Delaware county GIS Data:
Within the Delaware GIS data, the first data set is Zip code. Within this data set, all the zip codes in the Delaware county area are recorded. This data set is updated on an as-needed basis. The second data set is Street Centerline, which displays all recorded public and private roads within Delaware county. They collected this data through field observations of addresses and updated it every year. 911 emergency responses, appraisal mapping, disaster management use this data, and more. The next is the Recorded Document, which consists of recorded documents that are not represented by subdivision plates that are active. They update the dataset every week and use it for locating miscellaneous documents. The next is survey which represents surveys of land that were recorded within Delaware and is updated on a daily basis. The GPS dataset identifies all GPS monuments established 1991 and 1997 and is updated on an as-needed basis and contains very low dot density on the map compared to the previous data sets. The dataset includes all subdivisions and condos in Delaware, updates daily, and uses coloured map sections instead of individual dot markers to represent them. Parcel consists of polygons that represent all cadastral parcel lines in Delaware and is updated daily. School districts show all school districts within Delaware and get updated on an -needed basis and use large colored plots to show the separate districts and their locations within Delaware County. The township includes all 19 separate townships of Delaware, and the team updates it as necessary. They symbolise the tax district areas of Delaware on the map with highlighted sections and update it as necessary. Annexation records Delaware’s annexations and confirming boundaries all the way from 1853-present and is updated as-needed and includes very dispersed sections.
GIS Tutorial Chapter 4:
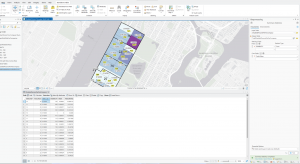
The first 2 chapters, you were creating your own ArcGIS map using the data provided. Calculating the data from the attribute tables challenged me the most in the first two tutorials because I was confused about selecting the field in the table to calculate, but clicking the header helped me figure it out. My favorite part of this was messing with the databases and creating new ones using the export tool because I found it straightforward. The third tutorial involved using the select by attributes tool and creating additional clauses, and looking at the effects in the attribute table. The next 3 chapters were all very brief and simple and included creating a central point layer, building a spatial join, and creating a table. Calculating the tract name was also challenging to me because I had an issue where I did not highlight the final exclamation point so when I pasted the expression, it was not correct. I am still confused how you know which expression to use for which calculation, but with the tutorial walkthrough in the textbook, it was easy to follow along after I corrected my previous mistake.
Screenshots:
GIS Tutorial Chapter 5:
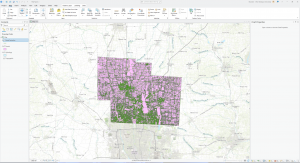
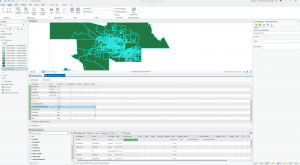
The first tutorial as well as the second of chapter 5 was extremely simple and displayed how to change map styles in ArcGIS. The third tutorial adds geographic coordinates that display a solid border around the designated post between the two maps. The fourth chapter, you use the export features tool and add the data in the map that you then adjust the symbology for. The fifth tutorial I found to be the most challenging of this chapter because of having to use the Microsoft Excel as well as create a choropleth map at the end using ArcGIS with data from the spreadsheet. I struggled to use Excel because the fields were not letting me delete them, so I had to move on without finishing this part. The final tutorial of this chapter was another simple tutorial that involved going to 2 different websites, browsing them and finding the given downloads, and downloading those and extracting them to the chapter 5 downloads folders. At the very end you simply add the data and adjust the symbology, which was my favorite part because you watched the map change and the impact that it made. This chapter was probably the hardest of this week’s assigned chapters because it was long and the fifth tutorial with the Excel worksheet was quite difficult.
Screenshots:
GIS Tutorial Chapter 6:
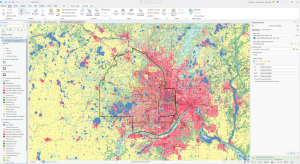
I found this chapter to be very simple, but also interesting and insightful. The first tutorial was similar to0 the tutorials in the previous chapter, where you adjusted the symbology and sorted and selected data in the attribute table. In the next tutorial, you use the export features tool and the pair-wise clipping tool, which you use for the rest of this chapter, and it allows you to export a new attribute. The next 3 tutorials, tutorial three, four, and five, were all very brief and followed a similar format with separate tools being used in each. Step 3 involves using the merge tool to combine separate waterways, while step 4 uses the append tool to view combined data points of firehouses and police stations, and step 5 applies the summary statistics tool and pair-wise intersect tool to intersect features and summarise street length. In tutorial 6 you use the union tool to create a new layer and calculate acreage. In the final tutorial, you tabulate the intersection tool to get an estimated number of people with disabilities in the area. This chapter followed a similar pattern with all seven tutorials, which made this one of the easier chapters so far but was insightful in showing how to utilize the various tools.
Screenshots: