Chapter 9
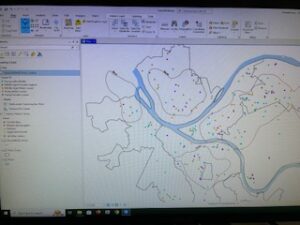
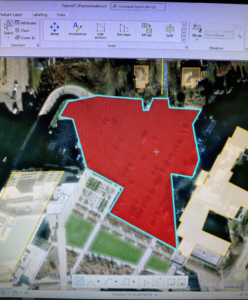
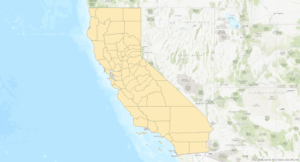
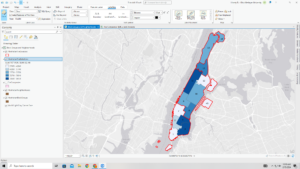
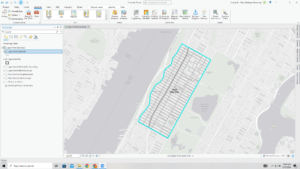
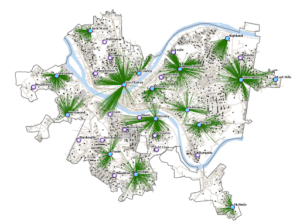
In this chapter, four spatial analytical methods were covered including buffers, service areas, facility location models, and clustering. The tutorials helped me understand how to use buffers for proximity analysis by running the pairwise buffer tool and multiple ring buffers. I was able to create service areas of facilities for calibrating a gravity model and locate facilities using ArcGIS Network Analyst. This chapter also taught me how to perform cluster analysis to explore multidimensional data.
Chapter 10
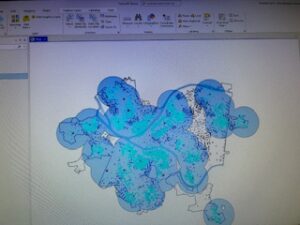
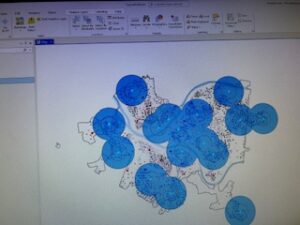
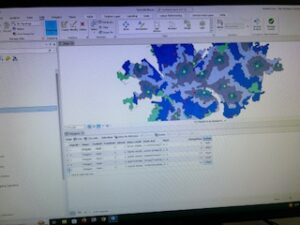
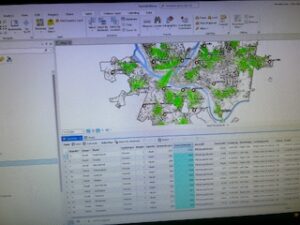
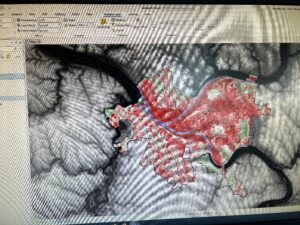
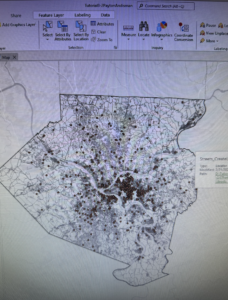
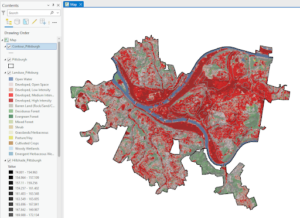
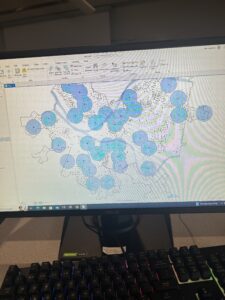
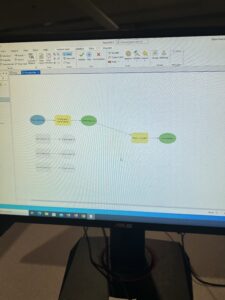
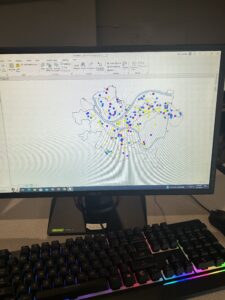
The tutorials had users process raster datasets to extract and symbolize maps and create hillshade maps. I learned how to make a kernel density map, or a heat map, as well as how to build a raster-based risk index model. It also required me to build a model for automatically creating risk indices. Throughout this chapter, I learned a lot about raster layers compared to vector features which we had been using previously. I found it useful when it taught me how to transform vector feature classes into raster datasets that could be visualized.
Chapter 11
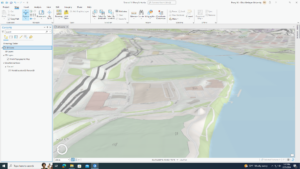
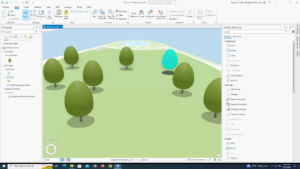
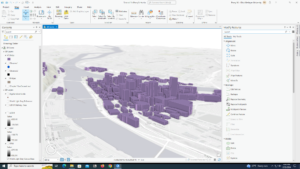
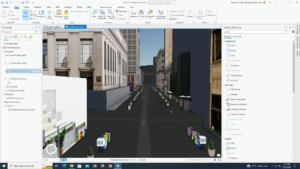
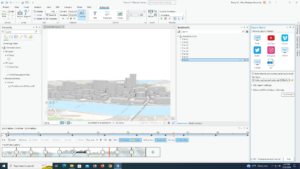
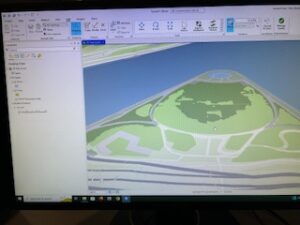
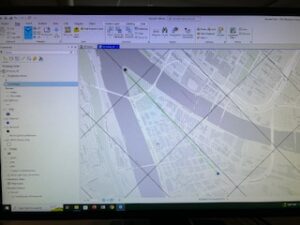
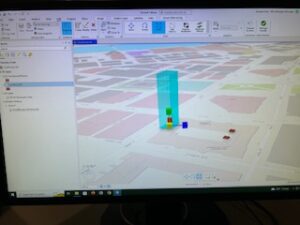
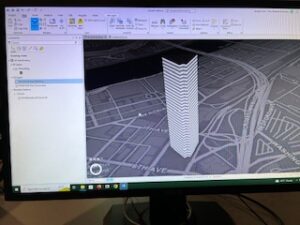
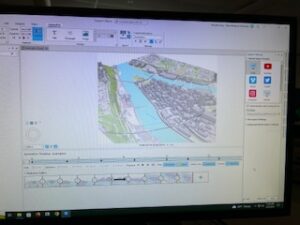
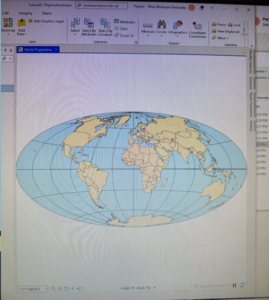
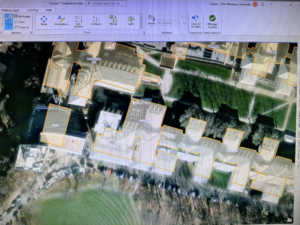
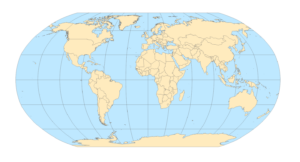
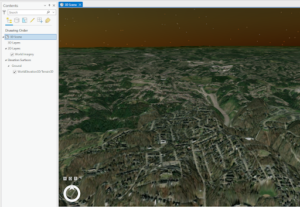
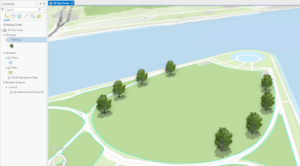
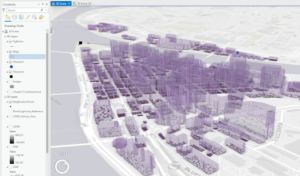
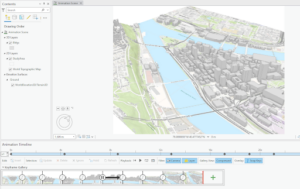
In this chapter I found it useful that the tutorial had us explore global scenes and taught me how to design, visualize communicate, and analyze them. The tutorials also had me create local scenes, TIN surfaces, and z_enabled features from this I learned the difference between global and local scenes. It allowed me to create 3D buildings from the lidar data so that I could work with the 3D features. I also used procedural rules and multipatch models but the parts I found most interesting, useful, and fun were creating the trees and the animation.

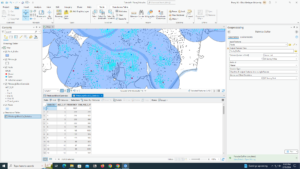
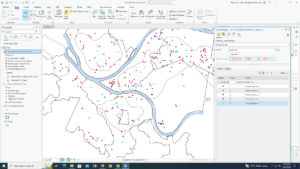
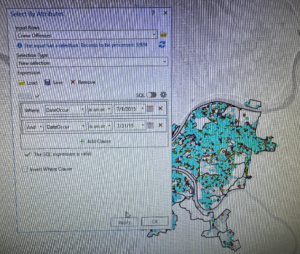
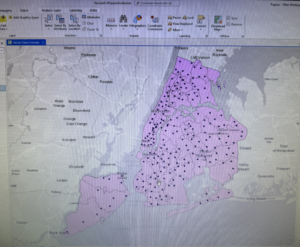
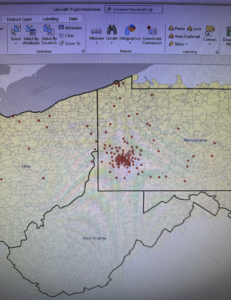
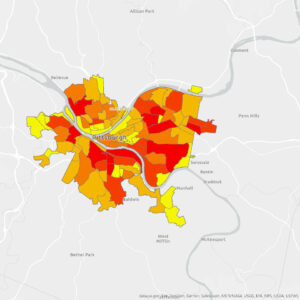
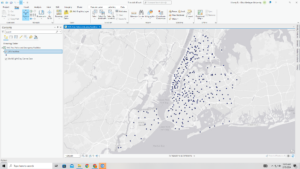
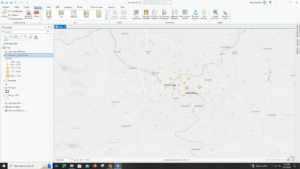
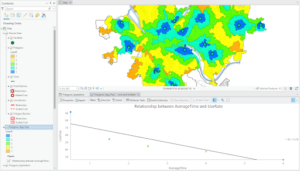
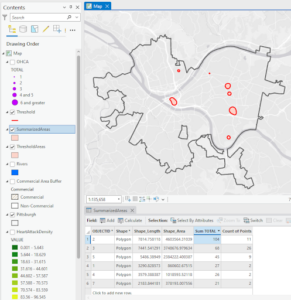
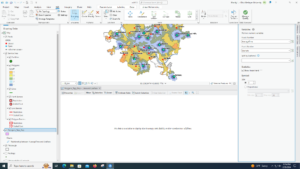 I got a couple error messages when I tried right click UseRate and clicked Calculate Field. I’m assuming it’s because I typed in the expression wrong, maybe I put spaces when I shouldn’t have. I believe this inhibited me from making a scatterplot, as when I typed in the X and Y axis fields, there was no button to apply or even in the Edit tab i wasn’t able to save. So I was unable to completely finish the project.
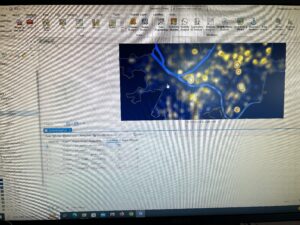
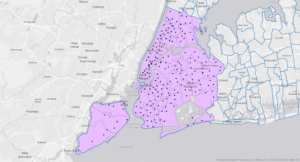
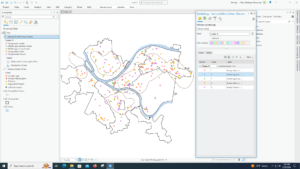 I liked the background of this tutorial. Mapping crimes, especially violent ones, are really important and its cool to see in real time how you can define the data to make it more understandable.
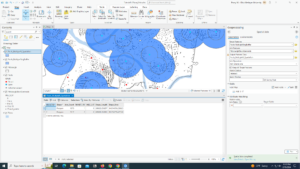
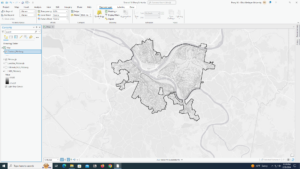
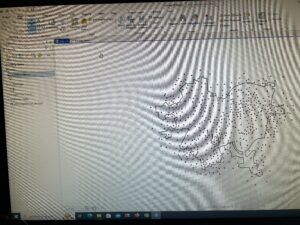
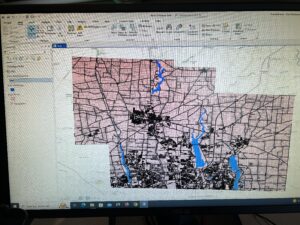
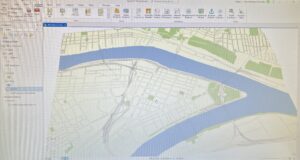
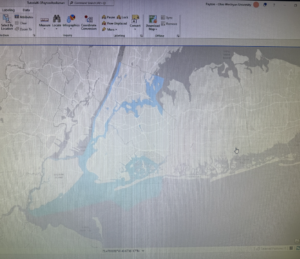
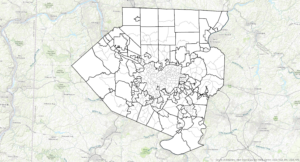
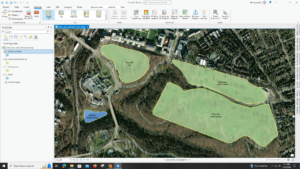
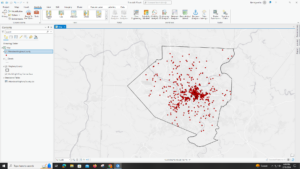
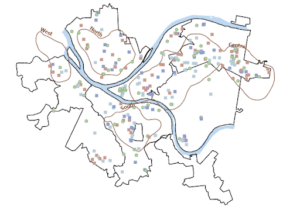
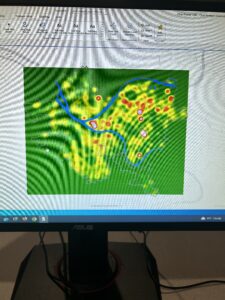
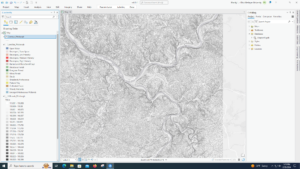 I don’t have “LandUse_Pgh” in my files, only “LandUse_Pgh.tif”. So, I have the land use for a good distance around pittsburgh instead of just the city itself. Actually, another time I tried to find it in the geoprocessing pane it was there. Sometimes files just don’t show up for me. I also don’t have NED_Pittsburgh, just NED. In the end, my tutorial looks just like the one from the book, except the Pittsburgh outline disappeared somewhere along the way and everything I did to the map didn’t just go inside the Pittsburgh limits.
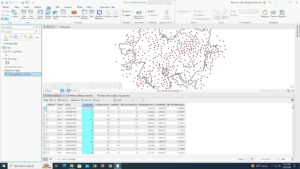
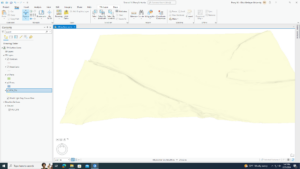
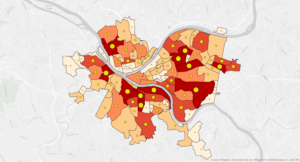
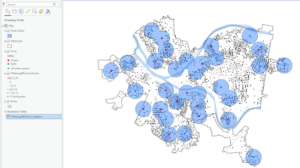
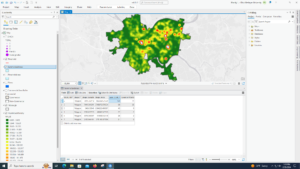 I thought that this tutorial was interesting. Learning how to make a heat map seems pretty cool.
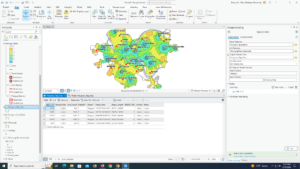
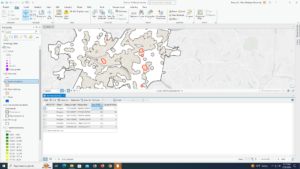
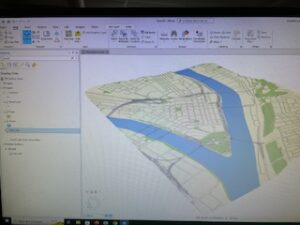
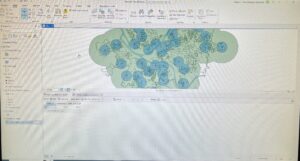
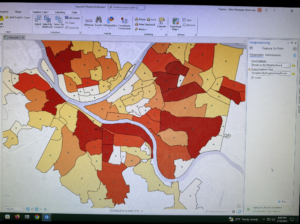
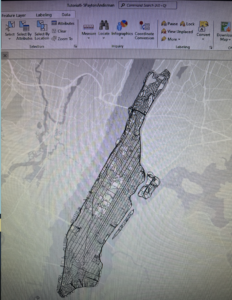
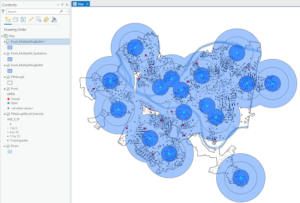
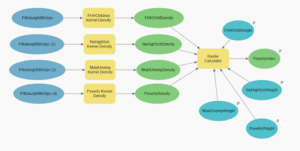
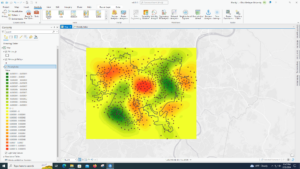 This tutorial was really long for me. I was able to do it all though, except for the fact that the poverty index model goes outside the Pittsburgh borders. Not sure why that happens to me so much. This was really complicated but seems useful.
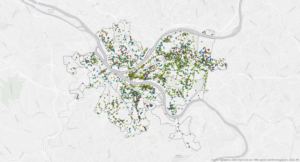
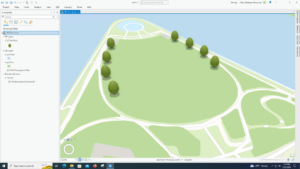 I don’t see the “Get Z From View” button. I also don’t have the cute trees the book has but it is a fun tool to know.
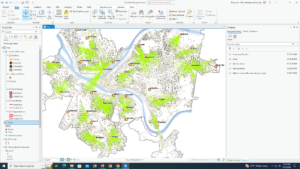
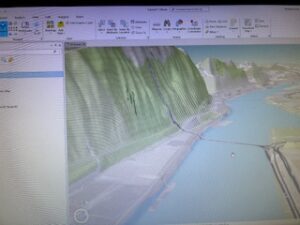
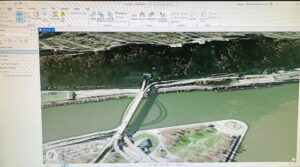
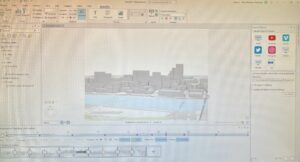
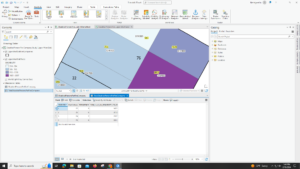
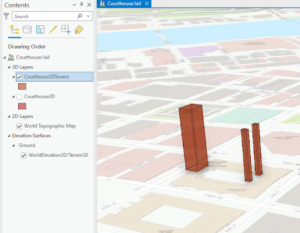
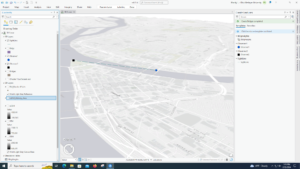 This tutorial was also interesting to do. Creating the buildings out of thin air was cool. I definitely messed up somewhere along the way though because I didn’t get the proper sightline at the end.
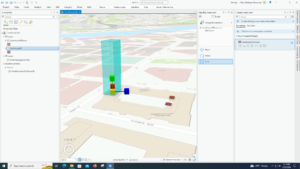 Not too sure how many uses these tools have, other than scale I guess.
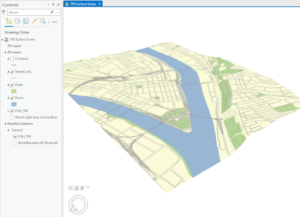
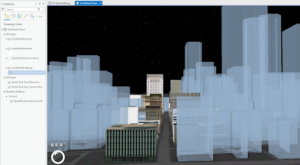
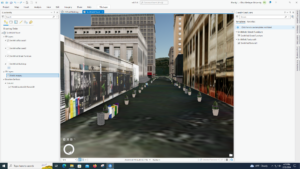 This tutorial was super fun. The end product, the Smithfield street 3D, was cool to explore and the little planters, trash cans, and fire hydrants were cute.