Huntington Week 1

Hi, my name is Max Huntington. I am a sophomore transfer student from Massachusetts. I am an environmental science major and I spend like to spend my free time reading or playing video games. I have never used GIS before but I am excited to learn.

This chapter was an interesting introduction to GIS and its history throughout the late 20th century.Ā  It is interesting that so many geographers have mixed feelings about GIS, but I suppose it makes sense in context. I was also completely unaware of the insane reach and scale of GIS in the modern world, the many ways in which it has affected my life are crazy to think about. All the different ways GIS can be used makes me glad I am taking this course, as the software is so broadly applicable that it will be helpful regardless of the field I end up going into. I am not entirely sure what the difference between spatial analysis and mapping is, but I gather it is related to the type and amount of information that can be extracted from the process. It is also interesting to see the threads of convergent development in the 50s and 60s across multiple countries and fields arriving at similar software solutions. I hadn’t heard of the concept of “black boxes” in that sense, but it is strange to think about just how many things in our lives operate in this manner. The average person (me included) does not understand the methods by which many things happen, but we accept them as fact nonetheless.

The National Weather Service has a fascinating online GIS portal that can display all sorts of weather and climate related data, from forecasts and advisories, to flood risk assessments and and satellite imagery for the entire country.


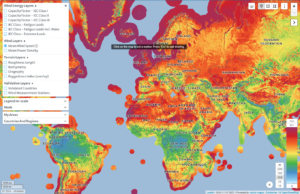
Another interesting application I found was the “Global Wind Atlas” used to determine the efficiency of wind power in various locations by the energy industry. It was created so professionals could determine optimal locations for wind power all over the world.

Howard Week 1

Hi, my name is Maddy Howard and I am a sophomore majoring in Environmental Studies & Geography. I am from outside of Cleveland, Ohio- Avon Lake, on the west side. I like coffee, hanging out with my friends, and occasionally photography. My campus activities include being a part of Delta Zeta Sorority šŸ™‚

I knew that GIS was something very important, but didnā€™t exactly know why, or really anything about it. I took this class to get a better understanding of GIS, as I knew that it was a skill to learn and know about, so I wanted to understand it more. This article really helped me understand more about the subject, including the background of it. I had no idea how many uses GIS truly has, from the well known use of navigation, to what you eat, to Starbucks using it, to police officers being trained in it, and so much more. Also, its foundations going all the way back to the 1960ā€™s and that it didnā€™t even use a computer was quite surprising to me. The fact that the development of GIS was happening simultaneously within multiple different countries not knowing of the others is also quite interesting. The background of GIS involving landscape architecture and surveying, not purely geography, and that its history doesnā€™t involve just technology, plus the actual history of GIS being of contempt, is also something I didnā€™t expect. The complexities between GISystems and GIScience is something I might need more clarification on, as even though broadly GIScience is the theoretical basis for GISystems, it is not as simple as that. I know it is explained a lot in the reading, but sometimes elaboration about certain topics just confuses me more. I also never thought about spatial analysis and relationships in GIS. Using that to predict future events is extremely interesting but also seems hard to actually do. Overall, learning about all the different ways you can use GIS makes me more excited about the class itself. Its complexities will surely be hard to understand, as anything that is woven into everyday life seemingly unnoticed that much of the time should be, but it will be interesting to try to figure it all out.

At risk terrestrial plant and animal species in the U.S.- This online GIS map shows the total number of species that are either listed as G1, G2, or federally endangered residing in each U.S. watershed. The data is from NatureServe in 2011. The owner of this map, Enviroatlas, is part of the EPA and provides geospatial data, tools, and resources about ecosystem services, ecosystem chemical and non-chemical stressors, and human health. This website, https://www.epa.gov/enviroatlas , provides more information about the map owner and creator.

https://m.arcgis.com/apps/mapviewer/index.html?layers=c481510217f347b7b026febd15839dca

Invasive species in Vermont- This online GIS map I came across shows sightings of invasive species. This data is from the State of Vermont Agency of Natural Resources Invasive Species Database, which provides information about invasive species and how to identify them for the public at https://anr.vermont.gov/special-topics/invasive-species.

https://www.arcgis.com/apps/mapviewer/index.html?layers=b1ae7b7b110447c3b452d9cacffeed36


Rose Week 1

Rose Week 1

  • Hello, my name is Evan Rose, a senior from Fairfield, Connecticut. I study Health and Human Kinetics here and I am a part of the lacrosse team. Because of this I enjoy studying exercise and movement along with the food we put into our body. I have used ArcGIS in the past as I was a part of the GEOG 292 class last semester but not the 291.


  • Because I took GEOG 292 and have some GIS programs, some of this was a review for me. I am well aware how powerful GIS mapping is and how it is used in all facets of our lives. It is used to look at almost an infinite amount of data regarding anything you can think of. Some of the things I did not know was the history behind GIS, especially it being founded and created so early. I figured a program with the amount of strength and use the GIS has probably would have been created later in history rather than in the early 1960s. GIS has an absurd amount of utility and versatility in the modern world as it helps us understand geographical trends. Because of this, GIS has created lots of controversy in the realm of geography as it changes how people perceive maps, data, and geography. People who know GIS and have been using it are thought to be out of touch with the quantitative side and how data is viewed when doing research. I did not realize the philosophical turmoil that GIS has caused since its debut and how it has influenced peopleā€™s way of thinking. However, after reading and thinking about it, it does make a lot of sense to me as a program like this with as much power and versatility was bound to shake up the very way people think and look at the field. However, I cannot completely understand the schools of thought and the true extent of influence GIS has had on our world as I am not deeply embedded into the field myself but I can understand that it does have significant impact.Ā 


  • I find studying food security or lack thereof around the world very interesting and GIS is used a lot in looking at trends in certain areas to help combat food insecurity. GIS helps map out areas of food insecurity and possible geographical reasons that lead to these issues

https://link-springer-com.owu.idm.oclc.org/chapter/10.1007/978-3-030-03273-9_8

  • Another thing I looked at was the rates of obesity. GIS was used in a study to mark hot spots and areas that are at risk for childhood obesity in Portugal. From this data they are able to come up with ways to combat this risk and increase the health of others in these areas.Ā 

Spatial distribution of the odds ratio of obesity at 7ā€‰years of age across Porto Metropolitan Area. (A) Unadjusted model; (B) adjusted for maternal education; (C) adjusted for maternal education and neighborhood socio-economic and built environment characteristics.

https://academic.oup.com/ije/article/49/3/934/5585655

Week 1 Maglott

1. My name is Sammy Maglott and this is my last semester of senior year. I am majoring in Environmental Science and Zoology. I run Cross Country and Track and am a member of the SEAL house.Ā 

  1. Schuurman Reading: Chp.Ā  1Ā 

It’s cool how GIS can be applied outside of the environmental field. I chose to take this class to fulfill my credit to graduate and because I noticed that in many job positions, I was interested in, experience working with GIS mapping was at least desired, if not a requirement. I thought it was really interesting that ā€œspatial analysisā€ and ā€œmappingā€ are very different. I was also surprised that spatial analysis allows more information to be obtained than mapping. Iā€™m still a little confused about what information spatial analysis obtains that mapping does not, though. Itā€™s strange to think that GIS is still fairly new as it was first introduced and used in the 1960s. I definitely could understand certain geographers being uninterested in switching from cartography to relying on computer spatial analyses. Growing up in a world where there was already so much technology surrounding us, I think our generation has been more apt to utilize technology. I think it would be difficult to switch from doing something by hand to trying to use a program on a computer. The part about the GIScientist was something that I had never heard of or thought about before. However, I think that it is important that there are people who question the reliability and accuracy of GIS results to ensure that the data we are collecting is correct and usable. It would be sort of a waste to use GIS to analyze lots of data and get a result that isnā€™t necessarily true or very accurate. I also had never considered how GIS might categorize things, like mountains mentioned in the book, and how these categories or boundaries could become very important when it comes to graphing things like areas in need of federal funding. In conclusion, GIS has a much broader application than I initially thought. Not only can it be beneficial to geographers, but can be used for farming, identifying disease outbreak zones, finding which roads are most likely to flood or degrade, planning electrical grids and gas lines, and much more!

3.Google Applications

Amanda J. Zellmer, Margaret M. Hanes, Sarah M. Hird, Bryan C. Carstens, Deep Phylogeographic Structure and Environmental Differentiation in the Carnivorous Plant Sarracenia alata, Systematic Biology, Volume 61, Issue 5, October 2012, Pages 763ā€“777, https://doi.org/10.1093/sysbio/sys048

This is a map showing the distribution of different carnivorous plants along with the location of bodies of water in each area. One GIS application used was CIrcuitscape, which allowed them to calculate the total resistance of the landscape separating the pairs of populations. GIS layers are used to find the resistance distance.

Kabatha, P. (2018). An open source web GIS tool for analysis and visualization of elephant GPS telemetry data, alongside environmental and anthropogenic variables. Master Thesis in Geographical Information Science.

This map shows the distribution of elephants where red areas show higher elephant presence and yellow areas show low elephant presence. GIS applications such as Python, Toolkit, ArcPy, and more were used to generate the map with the different bodies of water and landscapes as well as mark where elephant presence was the highest.Ā 

Gassert, Week 1

Hi there! Iā€™m Sydney Gassert. Iā€™m a sophomore majoring in ENVS with a strong interest in animal behavior. I was born here in Ohio, but have lived in California, Texas, and Arizona. Iā€™ve gained a lot of experience with animals over my time in high school in Arizona, working with an organization called Fallen Feathers. While volunteering there, I worked with wild birds to be rehabilitated and rescue parrots to find new families. I currently work at the Columbus Zoo in guest relations and at a vet/pet boarding facility as a kennel tech. After college, I hope to advance at the zoo and become a part of the animal care team either in the aviaries or with the pinnipeds!

A few more little fun facts about me; I play the violin, Iā€™m into photography, and I keep bugs as pets (that is my spiny flower mantis on my face in the pic I posted. Her name is Matcha and sheā€™s very silly)

Ā 

This chapter gave me a good refresher on what GIS is and what it can be utilized for. Iā€™ve never used an actual digital GIS system myself, but seeing this now I remember reviewing maps of Mexican wolf populations in Arizona for one of my classes I had in high school. We were challenged to analyze the map and figure out where the different wolf packs were traveling and where they frequented based on coordinates. If GIS wasnā€™t popularized when it was, a lot of advancements may not have been made. Without GIS systems, it would be harder to map out and identify different regions. Many different categories of people can benefit from GIS systems to do their jobs. Architects, biologists, oceanographers, and geologists just to name a few. The fact that you can also add different layers to GIS maps to show changes over time and movement is also incredibly fascinating and helpful to give a visual of migration patterns of animals for example. I hope to gain more knowledge on how to generate and use the GIS myself to possibly help a little in my career path.


Being that I have a heavy interest in animal behavior, I decided to take a look at southern resident killer whale sightings. I have an unhealthy obsession with orcas, so why not take a look at one of the most threatened populations? All of the circular dot marks on the map mean different things like foraging, feeding, and even social interactions between the pods. The square dots on the map indicate boat travel and types of boats that sail the same areas that the SRKWs frequent. This map shows a good amount of interference between boats and the whales, which can interrupt the whalesā€™ way of life.Ā 

https://www.arcgis.com/apps/mapviewer/index.html?webmap=226b74dc38ba46eba2e5d6317ddf0b54


Week 1

Hello! My name is Lily Bechina. Iā€™m a sophomore environmental studies major. I play on the volleyball team here. Iā€™m from Chicago. I donā€™t know exactly what I want to do yet but definitely something in the environmental studies field.


Reading through the short introduction, I found it interesting how geographers would dispute the value of GIS. I just didnā€™t quite understand how it could be bad. Of course, as I read on, I began to understand how using GIS takes away from other research methods that possibly require more and/or different skill sets.

The story about where GIS comes from (1962 McHarg) really helped me put into perspective what the basis of spatial analysis is and what purposes it serves. Visualizing a physical map on top of map on top of map helped me comprehend the fundamentals of GIS. Something else that helped my understanding was the calculator comparison. GIS is only useful to users if you understand how and why it works.Ā 

Reading about how GIS is based on two digits that are combined and composed to represent different things, I was reminded of work I did in high school engineering with interpreting and creating binary systems. I hope that this previous knowledge will help me in this course.

Something I hadnā€™t considered is how GIS is only useful in collaboration with humans. Unlike much modern technology, GIS only works if there are humans to use it. This is a comforting fact as the rest of modern technology is becoming more and more AI generated. This idea was further confirmed with the water well example. Dr. Snow saw an inconsistency in his data and was able to find what caused that inconsistency through some research. He found that his data was sound and the inconsistency was due to outside circumstances. This is not something that a software would be able to figure out (at least I don’t think it is).Ā 

I looked up “GIS Applications Chicago Public Schools”. I was interested in finding any information on public schools in Chicago. Instead, I found an interactive map where I could add many different features. The one that stood out to me was ā€œRecycling Drop-off Site.ā€ Being a big city, you would assume we have many of these. But, I canā€™t even think of one recycling drop-off site. So I clicked this filter and found that there are 6 drop-off sites within a 3 mile radius from my house. This is not a bad number but it was just interesting to see.

*green dots are recycling drop-off sites

https://gisapps.chicago.gov/mapchicago/Ā 

The next thing I looked up was GIS application death rates in the United States. It sounds grousome but I was interested to see where the highest death rates were. I found a map with the ranking for the causes of death. As I zoomed in, the map became more detailed, which is something I learned about in the reading.

https://www.arcgis.com/apps/mapviewer/index.html?webmap=e323996be3a845b1880f3cdd9381d369

Hagans Week 1

  • My name is Carsyn Hagans, and I am a sophomore majoring in biology and environmental science. Iā€™m from Archbold, OH- which is a tiny village up in northwest Ohio (nearly in Michigan and Indiana). I love to travel, hike, read, drink coffee, and work out!

  • Over the summer, I did a research internship where they introduced me to some basic GIS concepts and ideas. We used ArcGIS to make a few maps, but I was given a very brief background on the creation of GIS as a field and its many uses today. I know GIS is becoming an increasingly more important and widely used tool in many careers, especially in environmental science. This first chapter gave me a a really good idea of how GIS came to be and how there are many different definitions of ā€œGISā€. I had not really realized how many ways there are to utilize GIS, but the chapter brought up examples like soil chemistry, most successful stores, business routes, and crop blights all being represented through maps. When my family asks me what my GIS classes are, I usually just tell them that Iā€™ll be making maps on computers, but this reading talks about how thereā€™s more to it than that. GIS allows people to incorporate patterns and other trends into maps that give people a visual representation of the data. I truly think this is an important way to show data, and as the reading explains, peopleā€™s brains are much more equipped to interpret visual data. I am slightly confused about the ā€œtrueā€ definition of GIS, as the reading introduces several different ways that professionals have defined it in the past. However, I think that because the reading does go back and forth between these varying definitions, it does portray the complexity of GIS and potentially even represent how people who are unfamiliar with GIS may become confused by it. That being said, I think this first chapter did a great job at introducing how multifaceted GIS is and giving us ideas on how businesses and organizations incorporate it into our everyday lives. I am excited to continue to learn about the ways in which we can utilize GIS to display important information.
  • One interesting application for GIS I found on ChatGPT is crime mapping. It explained that law enforcement agencies can utilize GIS to map areas of high crime and then they are able to allocate more resources to these areas that would aid in crime prevention. This map is from ESRI/ArcGIS. It shows areas of high and low crime in the greater Chicago area. I think itā€™s interesting how they incorporated a confidence interval into the legend. (https://desktop.arcgis.com/en/analytics/case-studies/broken-bottles-3-pro-workflow.htm)
  • Another interesting application of GIS I found on Google is mapping animalsā€™ migration patterns or geographical boundaries. I think an application like this would be very useful in the kind of career I want to pursue. Research scientists can take advantage of GIS to understand patterns found in the natural world. This map from ESRI shows the abundance of the American Kestrel during different times of the year, such as breeding or non-breading seasons. I like how much information this single map provides, as well as how it explains what it is showing. (https://www.esri.com/arcgis-blog/products/arcgis-pro/mapping/how-to-make-this-migration-map-and-why/)

Nagel Week One

  • I am Christopher Nagel (just Chris is fine.) I am in my final semester of senior year and plan to graduate with an ENVS Major/Zoology Minor. Ohio native, from the capital of depression otherwise known as ‘Cleveland’.Ā  I have three animals at home, a Russian Tortoise named ‘Shell’, a Saharan Uromastyx ‘Zil’, and a Jersey Wooly ‘Oreo’. In addition to animals, I also find aviation and some maritime history interesting. My biggest hobby is fishing in which I am very avid in.
  • Truth be told, I have very little, if any, knowledge of computer software. The only software I have used previously have been RStudio in a few BIO classes and CAD all the way back in Middle School, both with a great deal of difficulty. As to why I decided to join the GIS class, it was due more to the insistence from academic supervisors to take the class and that it would be a good skill set to have in my career than it was my own will and decision to take the class. I have a very loose idea of what GIS is, so I hope to learn more over the course of the class. That being said, the reading does explain it a bit, albeit a bit confusingly. There is no single meaning to GIS given that the applications for it are very extensive and diverse, but boiling it down it seems to be the analysis of spatial patterns using a layered geographical layout. It also appears that GIS has been in use since or before the 1960s, which is interesting as now GIS seems synonymous with computers and programming, but computers didnā€™t really become a thing until the 1970s, and more so personal computers in the late 70s and early 1980s. Given that, Iā€™m not quite sure how it wouldā€™ve been used before then. Using the 1854 London Cholera Outbreak as an example of GIS is something I never would have considered. The famous discovery of the connection between the locations of contaminated water pumps and recorded cases did lead to an overall revolution in terms of sanitation and plumbing, so to see it be in use for so long is interesting. The various modern uses for GIS that Schuurman lists out, ranging from delivery logistics to taxes and the entire power grid, down to each circuit.
  • One application I found for GIS is estimating and mapping the spawning ground, habitat, and migration of Striped Bass on the Atlantic Coast, particularly in Chesapeake Bay. These models are made annually using a variety of data such as the size and quantity of prey, water oxygen levels, bioacoustics, and foraging models. https://www.gsmfc.org/publications/GSMFC%20Number%20043.pdf
  • Another application is for use in the aviation industry. Uses range from mapping flight plans, tracking aircraft, and controlling airspace. https://www.esri.com/content/dam/esrisites/sitecore-archive/Files/Pdfs/library/brochures/pdfs/aeronautical-info-management.pdf
  • Los Angeles International Airport Airspace

Bryan Week 1

  • Hello! My name is Jade Bryan and I am a freshman hoping to double major in Environmental Science and Anthropology. I am from Waco, Texas, but I have lived in Ohio for the past two years. I have experience in wildlife rehabilitation, but I am interested in learning more about botany and ecology. As for personal hobbies, I spend a lot of time on arts and crafts, as well as playing video games such as Minecraft, Hollowknight, Skyrim, etc. I hope to be able to learn and improve a lot over the course of this class! Also, the ā€˜rā€™ key on my laptop is broken, so I have to manually paste each one. Please forgive me if I miss any!


  • As someone unfamiliar with GIS, this chapter helped me understand a lot of the basic concepts of the software, as well as the history behind its creation and eventual widespread use. At first, I had thought GIS to just be fancy mapmaking, but now I am aware that its main purpose lies in analysis, which is more than any standard map can bring by itself. In addition, one of its main selling points is its versatility, as it can be used for anything from tracking animal populations to helping businesses understand their main demographics. However, because of this intense versatility, GIS has historically lacked much identity of its own. It is not just a specific software, but a specific approach; an approach that can be used by a variety of people in a variety of ways. Because of this, it has been hard to define over the past several decades. Even at its conception, it was marketed as a simple map making software, which is wholly undermining its value. This caused most of the mapmakers at the time to stray away from computerized GIS, and it has now only recently become fully appreciated. Personally, I found the figure of the cholera outbreaks to be very interesting. Because of our modern medical knowledge, it can be easy to forget that sewage wasnā€™t always known to be a key factor in many sicknesses. It’s extremely interesting to know that GIS was what helped people understand the correlation between pump location and disease outbreaks. Because of this, it’s very easy to see how this system could be absolutely game changing for the analysis of different fields. Personally, I would be very interested in using GIS in urban planning in order to introduce more fauna into the layout of cities and towns. I believe Delaware has actually done something similar, though I am unsure of the details of their use.


  • Speaking of urban planning, the city of Los Angeles has a public GIS map called the ā€œZone Information and Map Access Systemā€ (ZIMAS) in order to show city-zoning and land use information. This helps them with analysis and projections for a plethora of things, including housing and employment rate.
    https://planning.lacity.gov/blog/why-gis-technology-important-urban-planning


  • As someone from Texas, I know how important white-tailed deer are to my native state. Because of this, I thought it would be interesting to see if there have been any GIS maps created for the purpose of tracking them. There has been! While much simpler, this map at https://tpwd.texas.gov/arcgis/rest/services/Wildlife/TPWD_WL_WTDMU/MapServer shows the breakdown of different ecological zones based on soil, vegetation, land use, and deer population. While a much simpler map, it provides an interesting perspective on the diversity of Texas. Here is the map surrounding my home town of Waco, Texas.

Schtucka Week 1

Ā – Hello! My name is Pacey Schtucka and I am a freshman at OWU. I am majoring in environmental science with a minor in geography. I am from Wadsworth, OH. Since a young age I have always loved being outdoors. My love for being outside turned into a passion for the environment as I grew older. Now, I want to learn more about the ins and outs of it all

  • As I am starting this course, I have a very limited knowledge of what GIS actually is. The reading helped me to get a better grasp of what purpose GIS serves and who it serves. With that being said, I think that it is really awesome how it has so many different means to different groups. This reading showed me that from the beginning of its time, GIS has been extremely diverse and never has had one solid definition. I also found it interesting that now GIS is a computer program, but its origins come before computers were universally usable. One thing I am confused about is how this reading talked about GIS being different from mapping stating that, ā€œitā€™s differentiated from “mapping” because it generates more information or knowledge than can be gleaned from maps or data alone,ā€ but then goes on to say that some see it as an ā€œextension of mappingā€ (Schuurman). The reading goes a lot of back and forth stating different viewpoints on GIS so perhaps my confusion may just be coming from interpreting the viewpoints wrong. Furthermore, I was unaware of how incorporated GIS is into everyday life. GIS is something that I first heard about my first semester at OWU. My peers told me how learning GIS would be a useful skill and I took their word for it. This reading by Schuurman is opening my eyes to a whole new perspective in the sense of GIS. Schuurman describes in the reading how almost everything can be brought back to GIS. She gives the example of food; every step from growing the food to how it gets to your plate can be brought back to GIS. It was really interesting to read about Schuurman breaking down every which way GIS is involved in a process that I did not even consider it to be involved in before reading.


  • One application I find interesting is GIS to study glaciers. Using ChatGPT, I found that GIS is able to map out glaciers and then the mapping is used to show the change and help look into the melting rate. From this I googled GIS glacial change and I found the World Glacier Monitoring Serivce on. WGMS teams with ESRI ArcGIS and allows people to view the glaciers over time.Ā  https://www.antarcticglaciers.org/students-3/resources-for-teachers/exploring-present-day-glaciers-in-a-gis/Ā 
  • Also using Chat GPT I found the GIS is used for disease mapping. GIS is able to be used to map different regions for disease spreading and to see what areas are affected. This made me interested in the use of GIS for COVID-19 mapping. I found this map from ArcGIS at https://www.arcgis.com/apps/dashboards/bda7594740fd40299423467b48e9ecf6 . This map was last updated on 3/10/23 but until then they used GIS to map the number of COVID-19 cases around the world.Ā