
I’ve updated the Evaluation Page with details of what you have to do to finish up the course.
Geography 353 | Ohio Wesleyan University

I’ve updated the Evaluation Page with details of what you have to do to finish up the course.
 For our final reading of the semester, we’ll review a recent article from a special issue of the academic journal Cartographica called “Decolonizing the Map: Recentering Indigenous Mappings.”
A PDF of the introduction to this special issue is here. The abstract for the introduction to this special issue reads:
“For over five centuries, cartographic map-making has played a pivotal role as a political technology of empire-building, settler colonialism, and the dispossession of Indigenous lands. Yet Indigenous peoples themselves have long engaged in their own mapping practices to share ancestral knowledge, challenge colonial rule, and reclaim Indigenous “place-worlds.” Although there is now a sizable body of scholarly literature on the mapping of empire, this special issue on “Decolonizing the Map” aims to recenter Indigenous mappings and decolonial cartographies as spatial practices of world-making. In this introductory article, we provide an overview of the theory and praxis of decolonial mapping and outline the key themes of the contributions to the present special issue. Drawing upon insights from this edited collection, we conclude that decolonial mapping requires a recentering of Indigenous geographical knowledge, respect for Indigenous protocols, and the active participation of Indigenous peoples in the mapping process itself if the project of decolonizing the map is to truly move beyond the colonial cartographic frame.”
That covers quite a bit of complex ground:
But then also: “Indigenous peoples themselves have long engaged in their own mapping practices to share ancestral knowledge, challenge colonial rule, and reclaim Indigenous ‘place-worlds.'”
In other words, the suggestion is that mapping has been a devastating tool used against the interests of Indigenous people, but it need not necessarily be so, especially with a strategy and methodology for “decolonial mapping.”
We will read one article from this special journal issue, “Spatial Data and (De)colonization: Incorporating Indigenous Data Sovereignty Principles into Cartographic Research” by Annita Hetoeve·hotohke’e Lucchesi. This is published as Cartographica 55:3, 2020, pp. 163–169.
The abstract from Hetoeve·hotohke’e Lucchesi’s article:
“This article asks how a better understanding of Indigenous cultures as inherently scientifically rigorous can change how academic researchers do work in Indigenous communities, and how non-Indigenous researchers, particularly those in fields such as cartography and geography, can learn from Indigenous ideas of protocol and sovereignty as part of the scientific process to transform their work in our communities into something that truly benefits Indigenous peoples. In exploring these questions, this article posits Indigenous data sovereignty and traditional diplomatic protocols as a means of strengthening cartographic and geographic research in collaboration with Indigenous communities and argues that integrating these principles into such research is necessary for work that strives towards decolonization.”
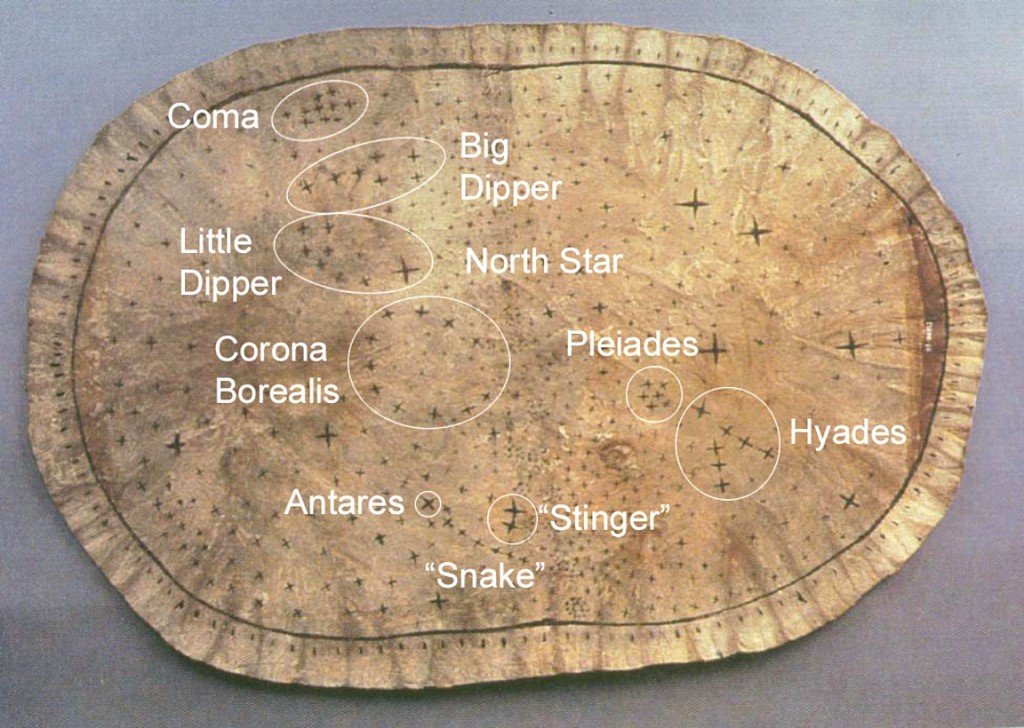 |
Pawnee “Star” Chart
|
Here too are some interesting propositions:
It would seem that considering the context of Indigenous people, as a source for mappable information and a guide for mapping practice, might be applicable to any situation where you are engaging with people, generating data, and mapping. For example, one might imagine how these ideas could be applied to the generation of the data for and map of the counter food desert map from the “Desert Wonderings” article we read earlier.
Please read the entire article (and the introduction to the special issue if you want).
Introduction (Braden, Carroll)
Cartography in Indigenous Communities: A Brief History of Where Things Have Gone Wrong (Hayes, Wade)
“…this argument is not about defending the validity of Indigenous epistemologies by comparing them to Western practices. Instead, it seeks to position Indigenous practices as science in their own right, without a need for comparison. Indigenous science, and all the culturally specific variations of epistemologies and practices within it, does not need to prove itself (and certainly Western science never had to do so) or be measured or quantified; it simply needs to be acknowledged as valid and made space for.”
Indigenous Data Sovereignty and Land-Based Best Practices
“Indigenous data sovereignty is a term used to describe Indigenous peoples’ rights to own data about themselves and their communities and to determine who accesses those data and how they are used and what data on their communities are collected and how.”
• it would be nice if all of us had this kind of sovereignty over our own data
“I build on the IPSG’s declaration by arguing that Indigenous diplomatic protocols such as those at the camp to defend Mauna Kea are an expression of political and cultural sovereignty, and their teachings can help us better articulate how to uphold data sovereignty in mapping work within Indigenous communities. These protocols are indeed uniquely suited to guide cartography projects, because they are rooted in connections to land and territory as well as building relationships across places and cultures.”
“A “best practice” for upholding Indigenous data sovereignty inspired by such diplomatic protocols might be that researchers approach Indigenous communities first by asking permission to be there, introducing themselves and the networks to which they are accountable, and offering their skills and gifts for the community to use as they see fit. This is a radically different perspective from the bulk of academic work done in Indigenous communities, and even the IRB/HSR process as framed by Western institutions, both of which are structured around receiving consent for the researcher to collect something he or she want, rather than asking the community what they need or want.”
Indigenous Data Sovereignty and Cartography: Charting a Decolonized Future (Gupta)
One more recommendation: “…it’s all about relationships. As researchers, we have a responsibility to build relationships with the communities in which we work, defined by deep respect, humility, and generosity. The research will be better for it, as will our communities. No matter what culture, community, institution, or discipline we come from, we are each diplomats representing something bigger than ourselves; it is on us to represent those things in a good way, and to work with Indigenous communities and sovereign nations with the respect they command and the inherent self-determination they carry.”

“Feminist Data Visualization” by Catherine D’Ignazio and Lauren F. Klein is a precursor to the book published last year called Data Feminism. We will read and discuss the former, but I’ll include some details from the latter below.
“Feminist Data Visualization” PDF here.
Data Feminism book information here.
Ponder these questions, look up citations, and google stuff: examples are always good:

| Donna Haraway, Primate Visions (1989): Successive ideas and paradigms in primate research (on topics like parenting, behavior, sex, resource use, and warfare) have tended to reflect the historical social concerns and anxieties of the period of their investigation, and were often imbued with sexist, racist, and colonial discourses.”
(image source) |
 |
|
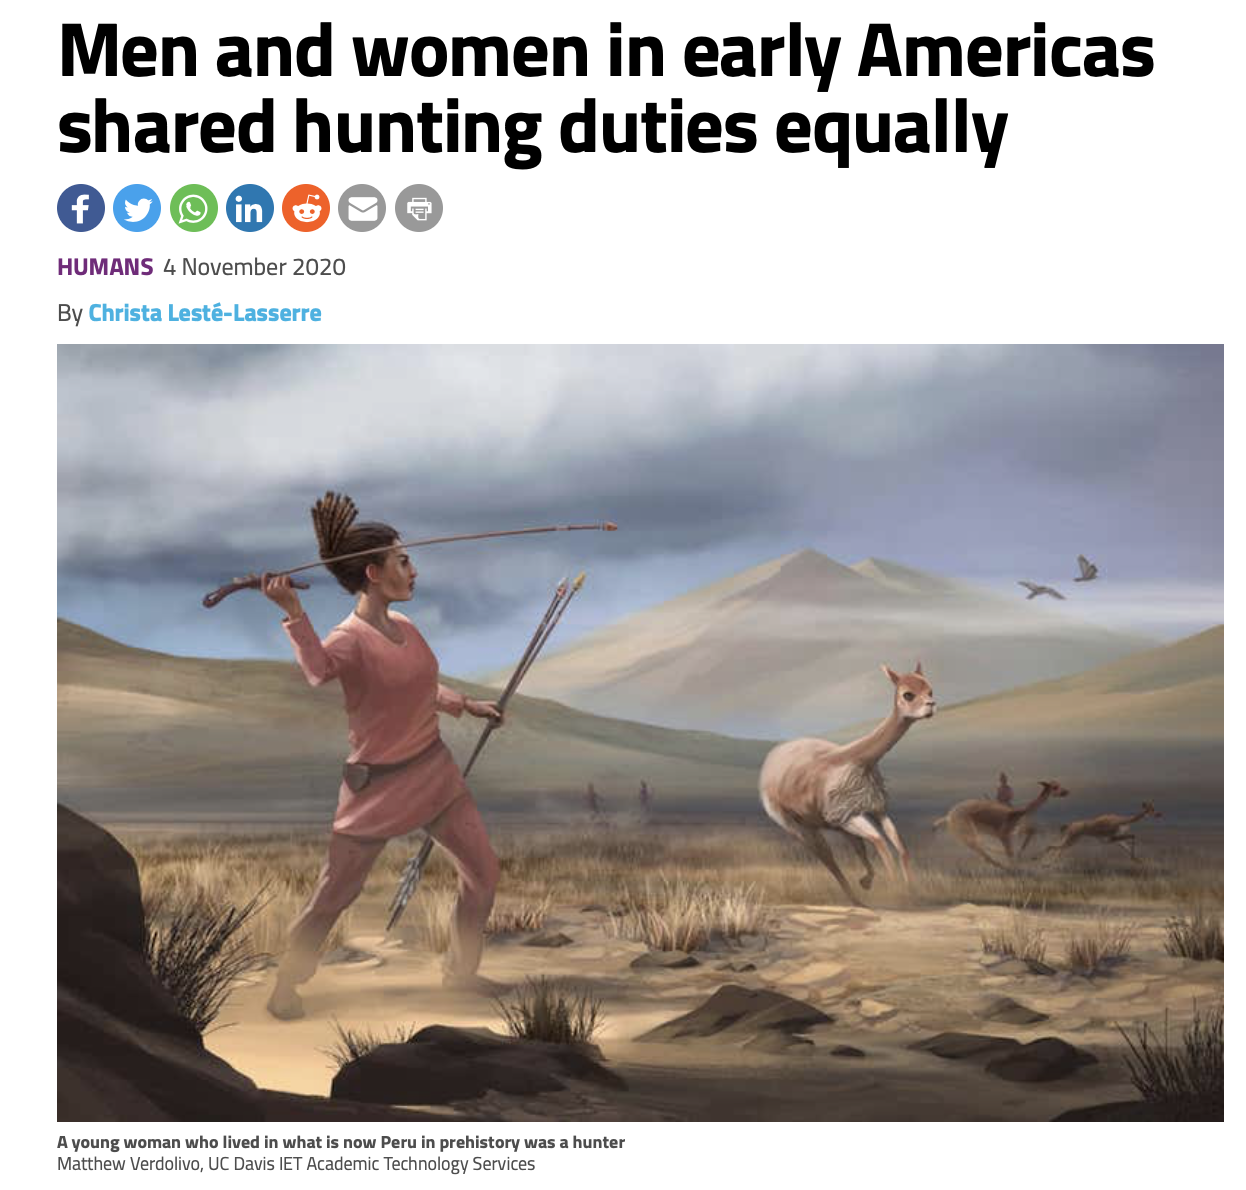
A young woman buried with stone tools including spearheads 9000 years ago in what is now Peru probably hunted animals including deer. The finding may help overturn long-standing assumptions about gender roles in ancient hunter-gatherer communities in the Americas.
Within present-day hunter-gatherer communities across North and South America, women make up at least one-third of the hunting force, and possibly as much as half, says Randy Haas at the University of California, Davis. However, although archaeological investigations over the past century have also found hunting tools in the graves of prehistoric women throughout the Americas, Haas says it took the unearthing of a young woman’s bones in the Andes mountains for scientists to set aside their unconscious biases about gender roles and recognise what they were seeing. “There is sexist ideology in Western culture that may have slowed our ability to recognise females as hunters in the past,” says Haas, adding that he himself was “surprised, unfortunately” by his discovery. “Even some of the most forward-thinking feminist scholars had accepted it to be true [that women weren’t usually hunters],” he says. |
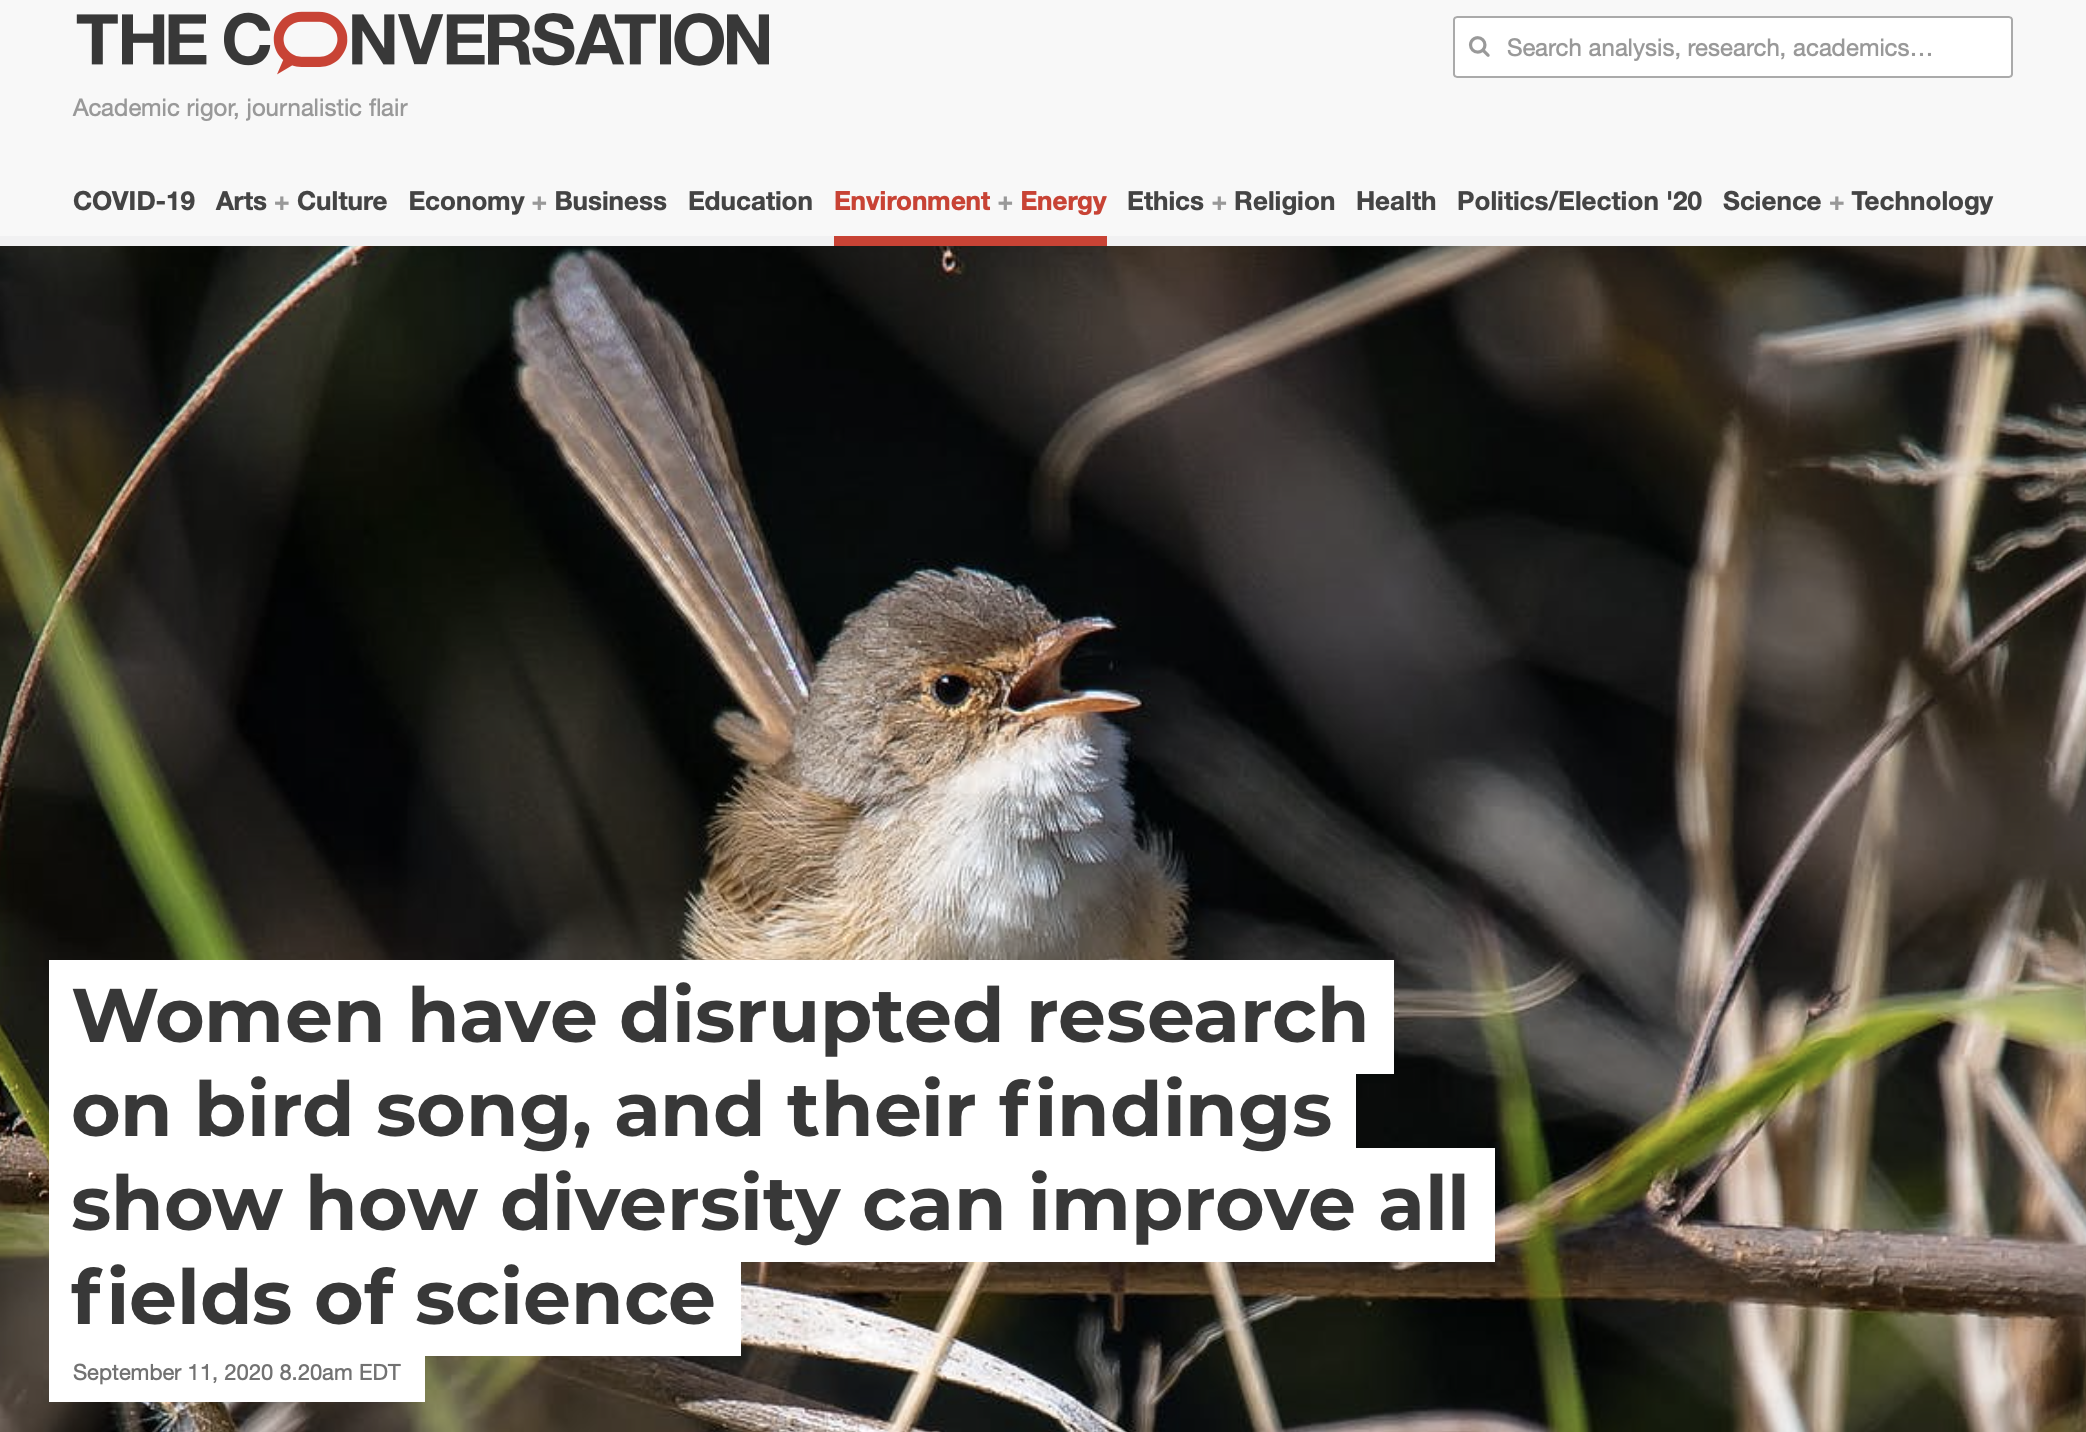 |
Americans often idealize scientists as unbiased, objective observers. But scientists are affected by conscious and unconscious biases
For more than 150 years, dating back at least to Charles Darwin’s writings on sexual selection, scientists have generally considered bird song to be a male trait. But over the past 20 years, research has shown that both males and females in many bird species sing Recent findings have shown that female song is widespread, and it is likely that the ancestor of all songbirds had female song. In a recently published study, we reviewed 20 years of research on female bird song and found that the key people driving this recent paradigm shift were women. |
Krygier’s Notes and Thoughts
Collections to look at…
1 INTRODUCTION
 (source)
 (source)
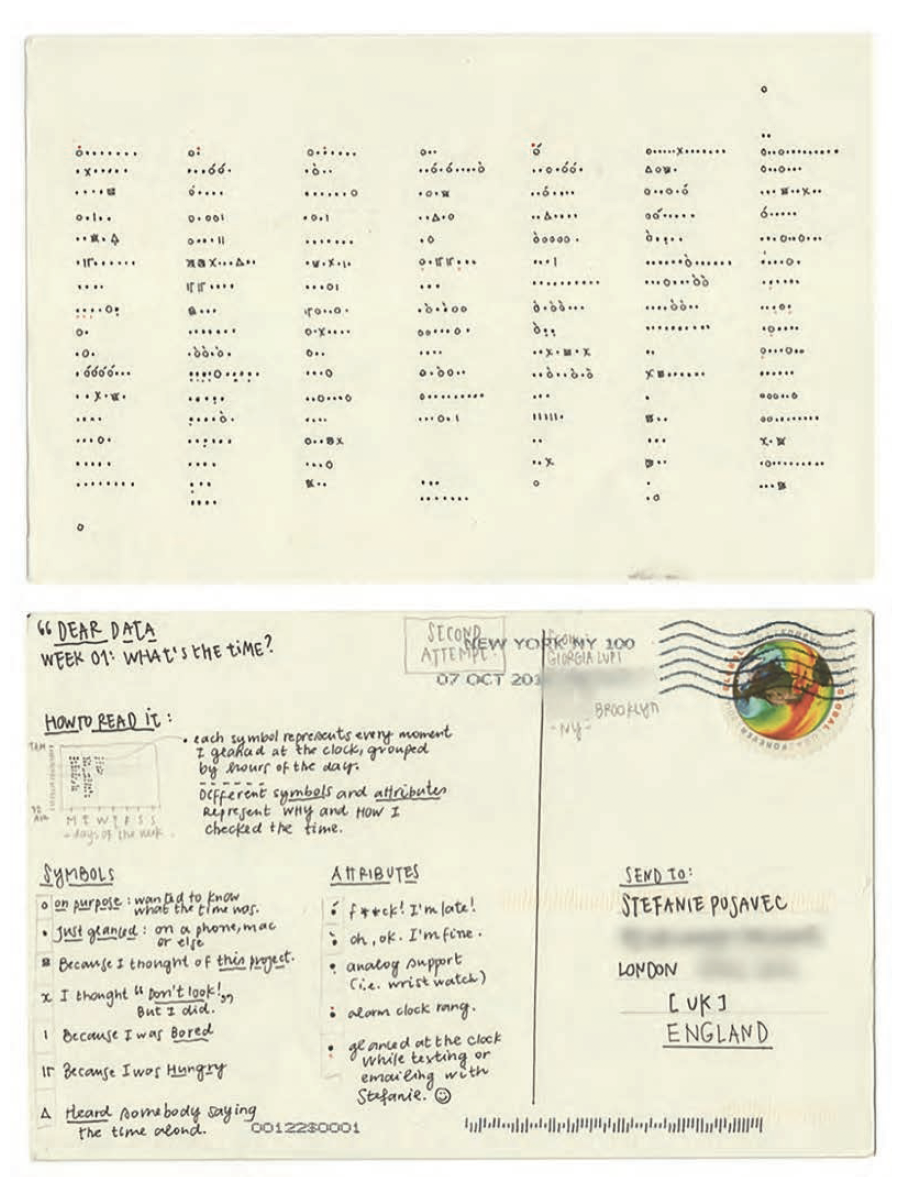
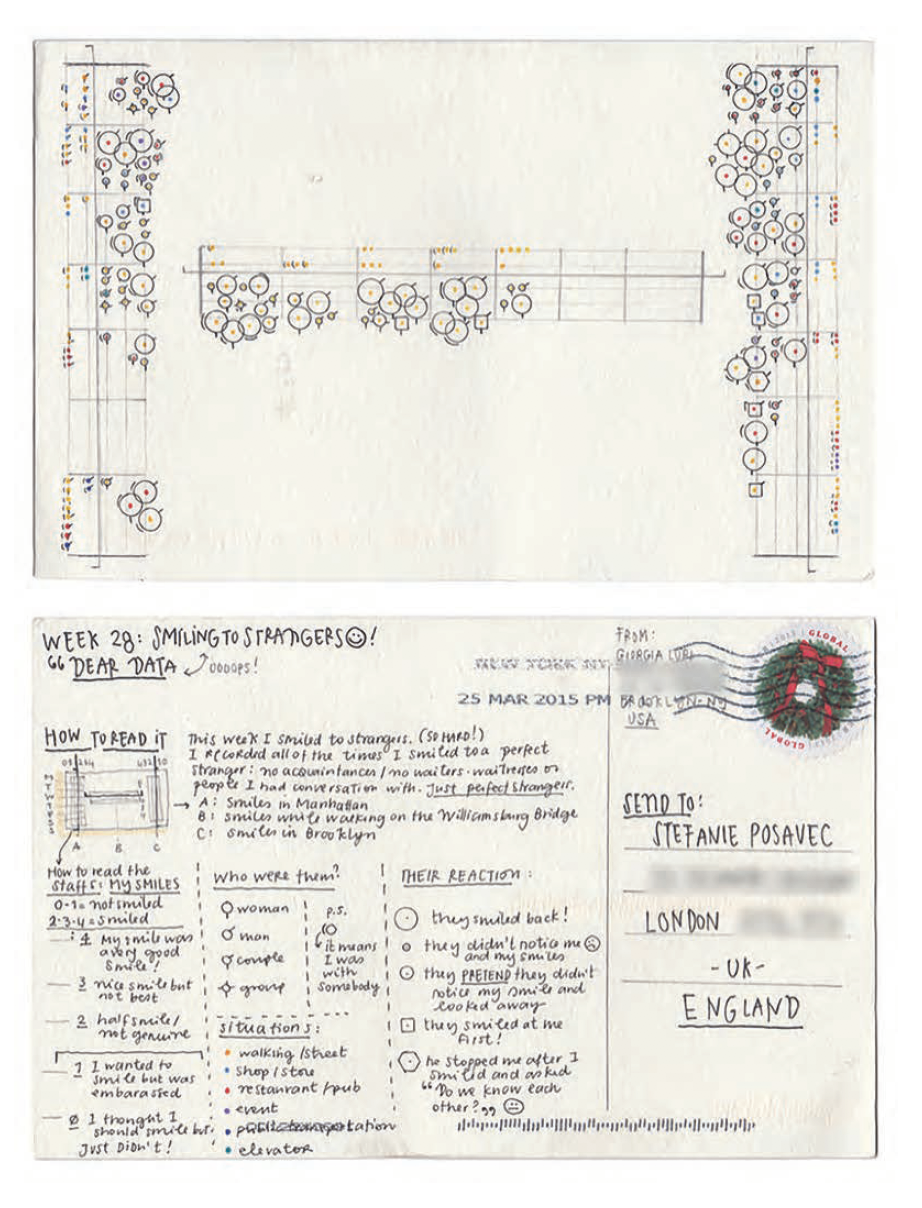
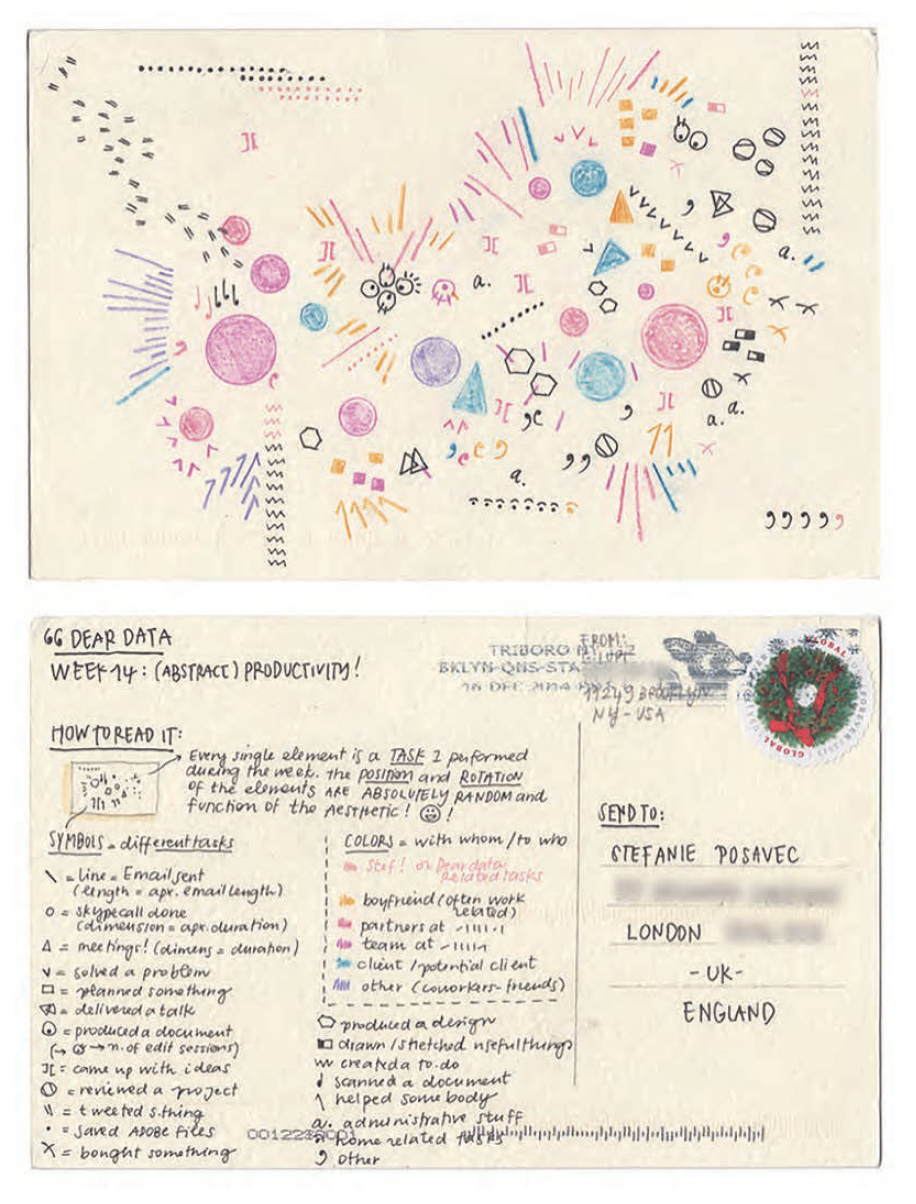
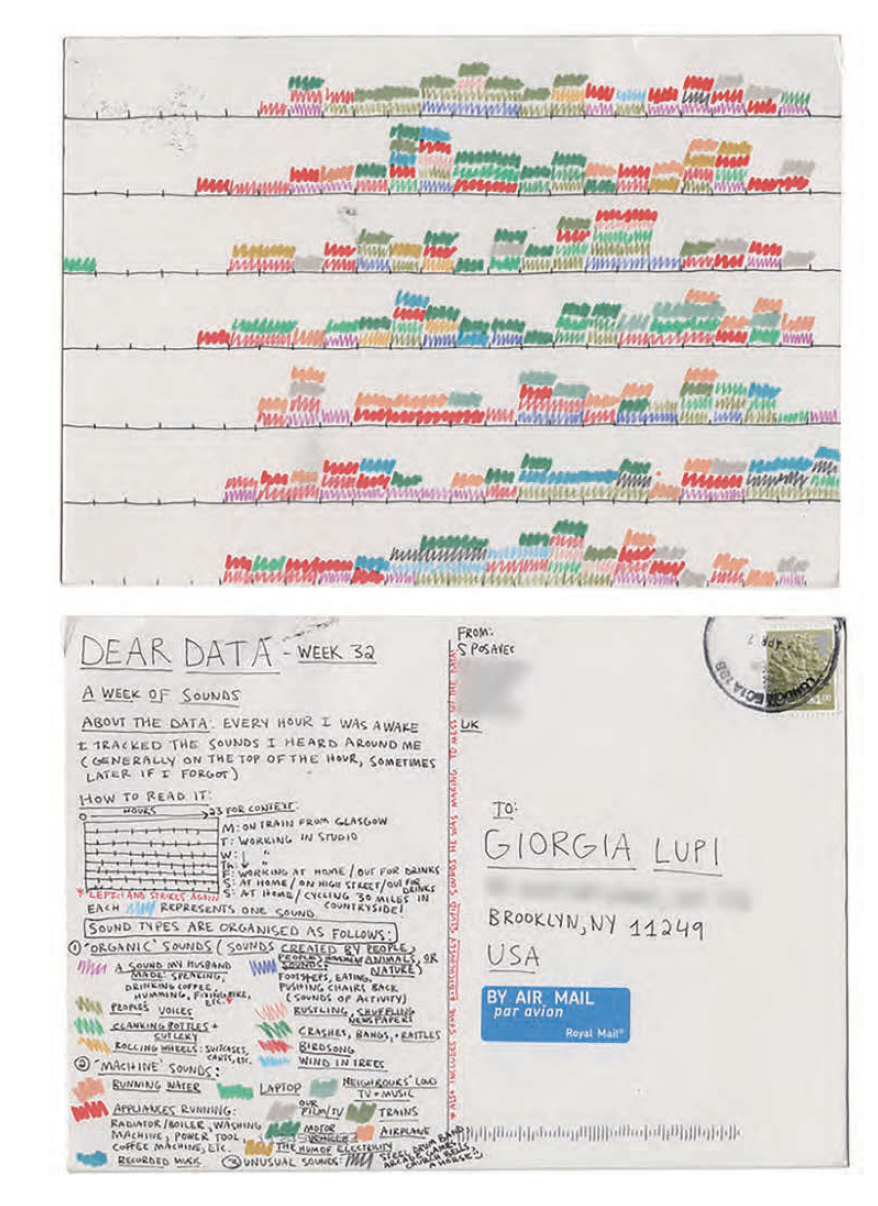
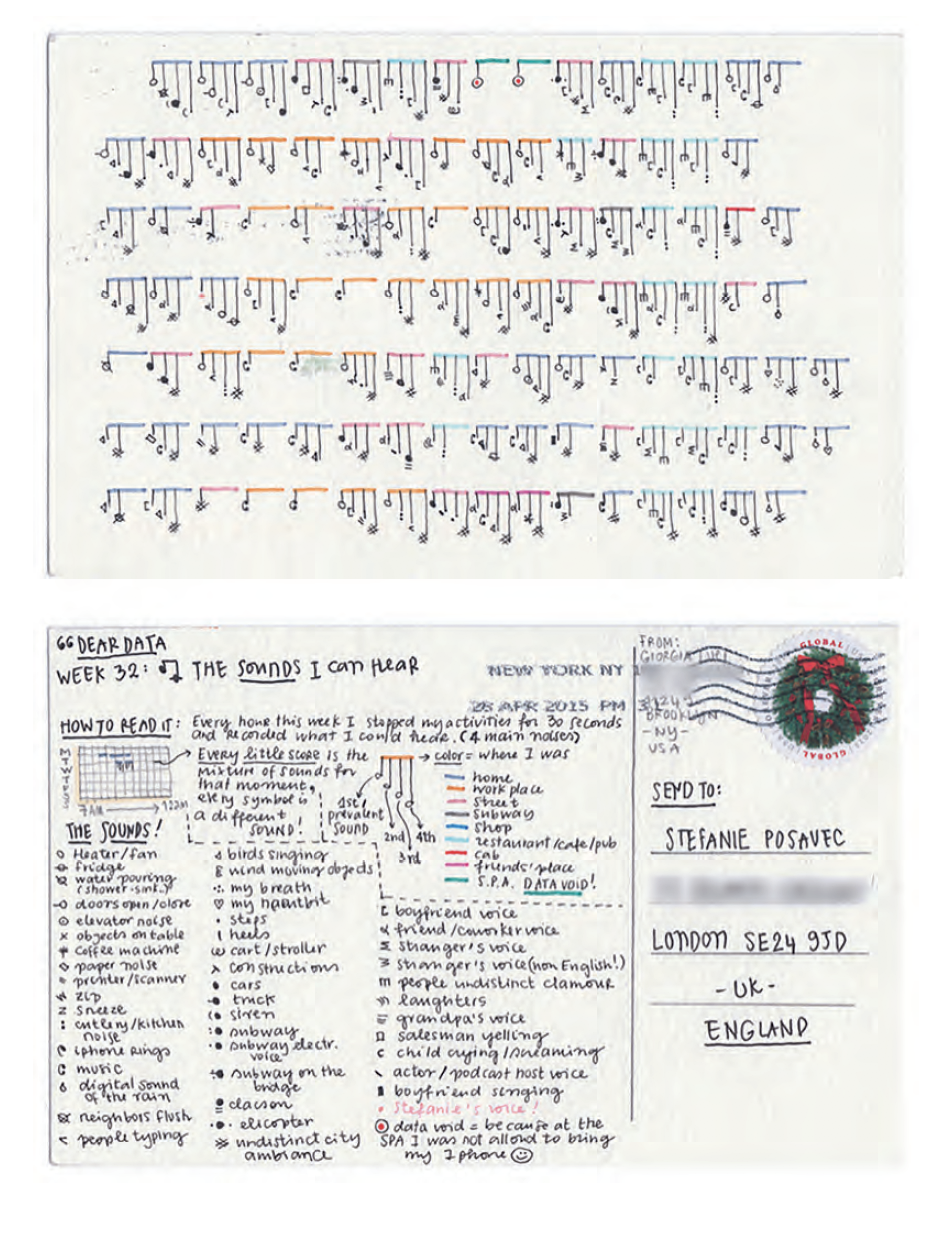
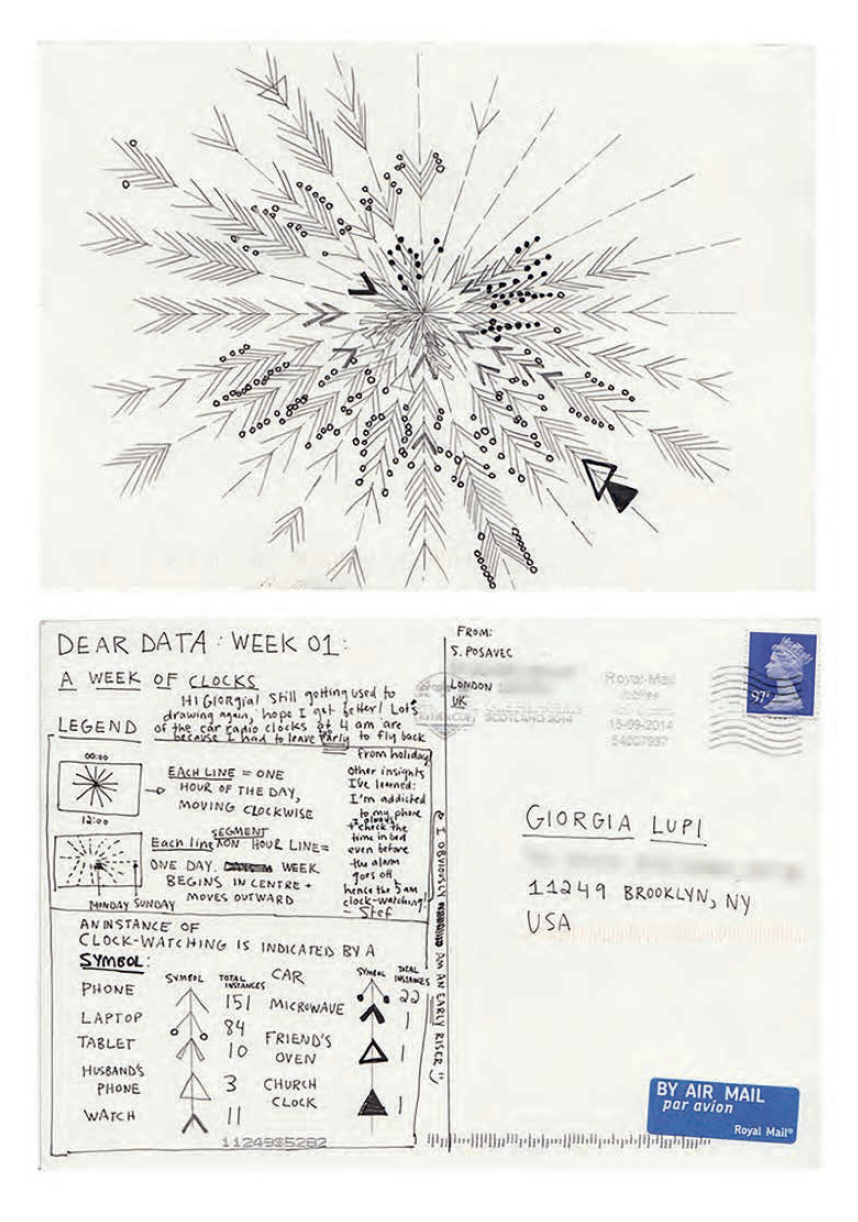
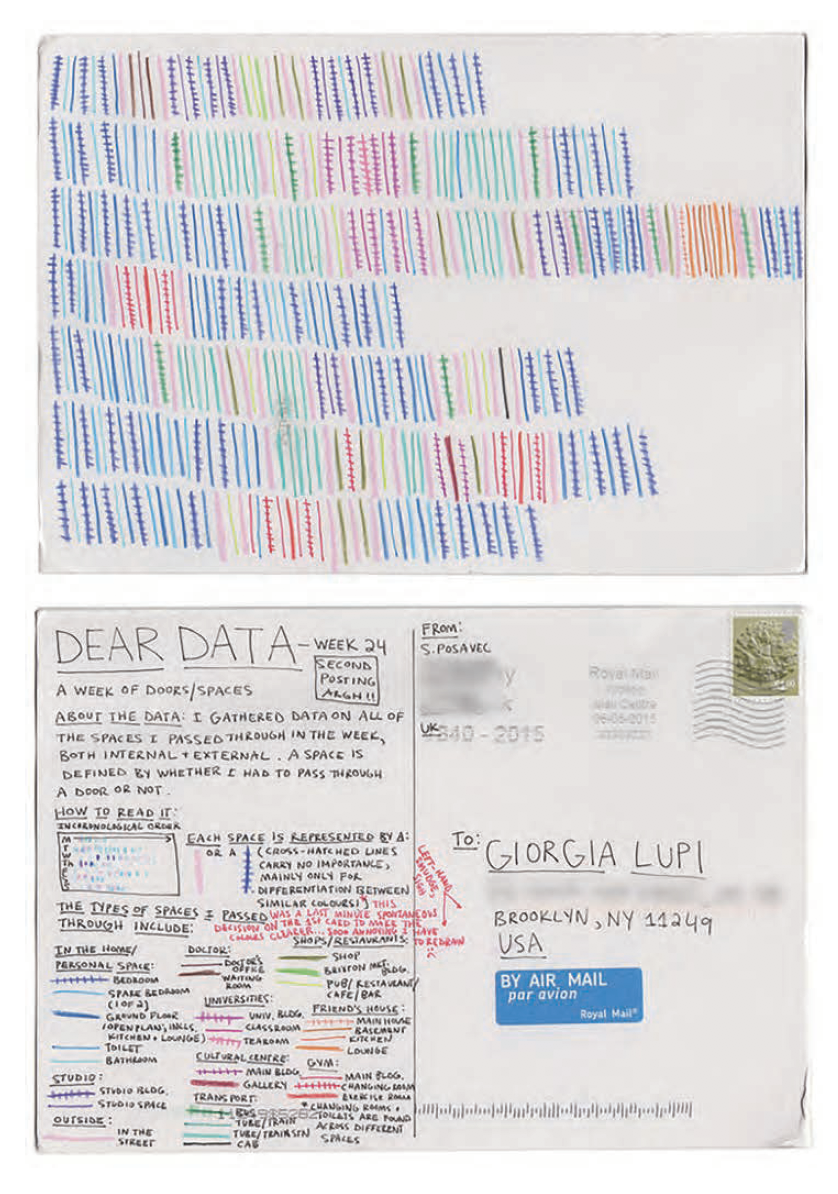
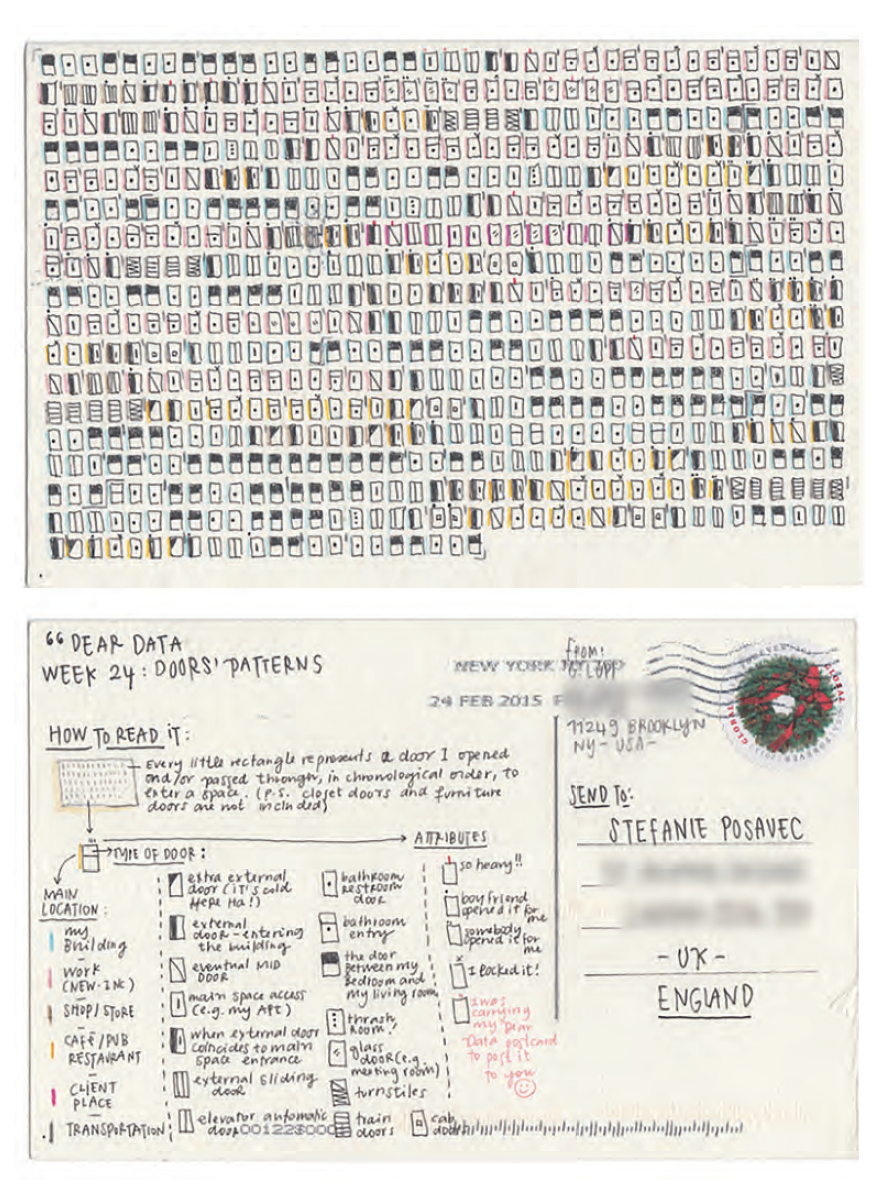
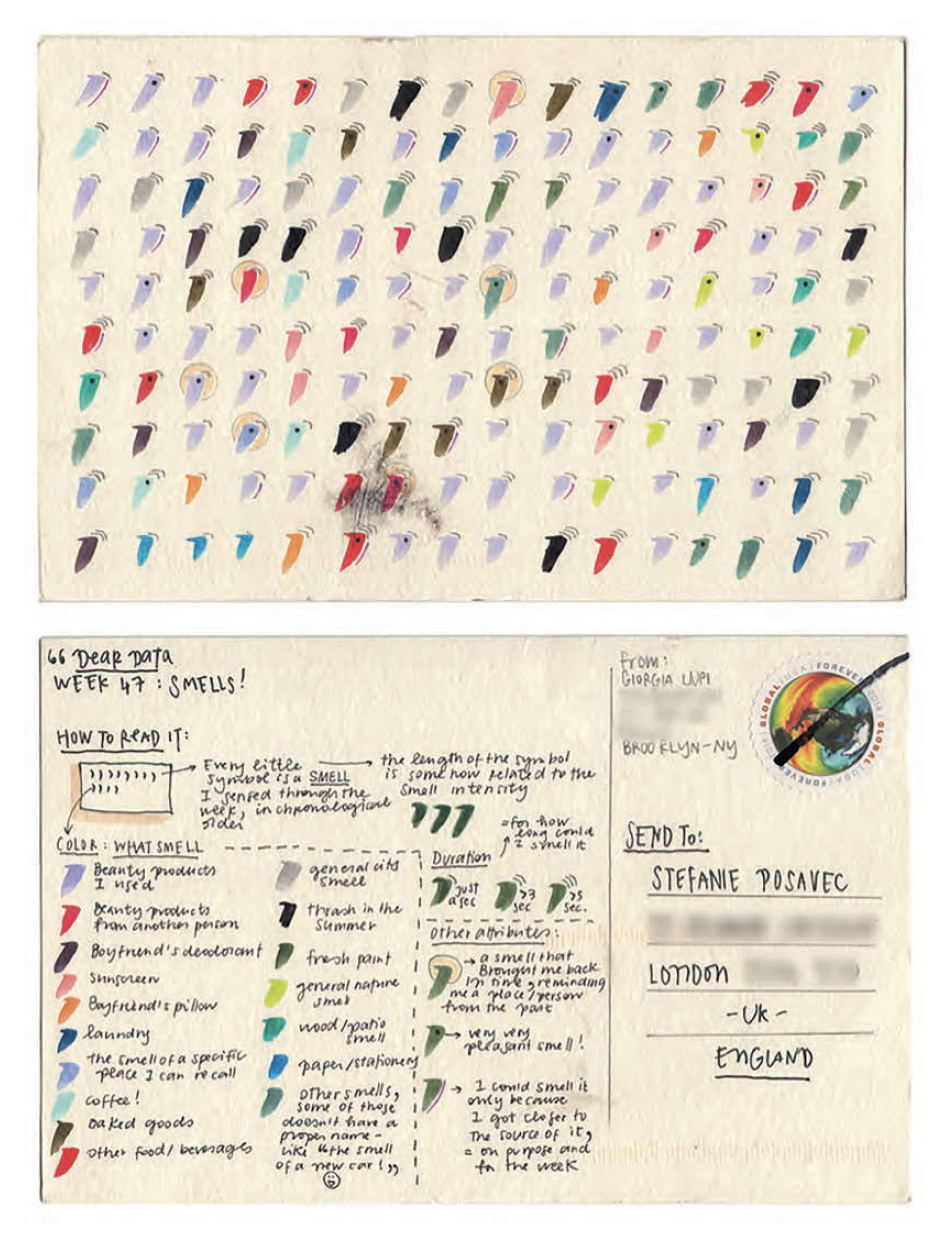
“Dear Data: Feminist Information Design’s Resistance to Self-Quantification.” Miriam Kienle, Feminist Studies, Vol. 45, No. 1 (2019), pp. 129-158.
Every Sunday for one year, information designers Giorgia Lupi and Stefanie Posavec sent each other a hand-drawn postcard that featured a data visualization of their week as it pertained to a single aspect of their daily lives: doors opened, clocks checks, sounds heard, smells perceived, and so on. With this series of postcards exchanged between Brooklyn and London, Lupi and Posavec gained intimate knowledge of one another through their small/slow data, and at the same time, they produced a critical examination of the capture, interpretation, and visualization of their daily data from a uniquely feminist perspective.
 |
 |
 |
 |
 |
 |
 |
 |
 |
2 RELATED WORK
 (source) and hierarchical
 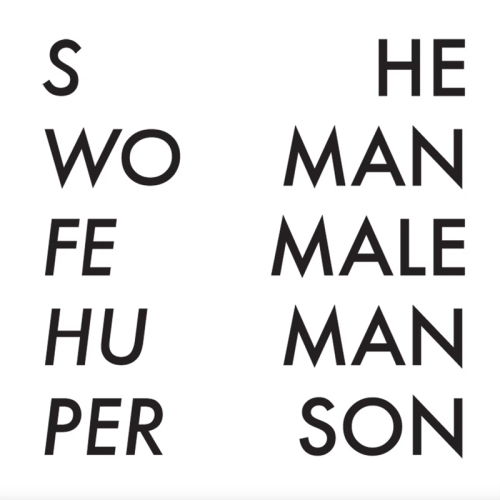 (source) configurations.
 (source)
2.1 Feminist Science and Technology Studies
 (source)
2.2 Feminist Human-Computer Interaction
In both feminist HCI and critical information visualization, researchers have introduced design principles that attempt to draw attention to how knowledge resides in specific bodies (disclosure/self-disclosure, embodiment), how power is distributed throughout the design process (empowerment, advocacy, ecology) and how to include more voices and alternative perspectives in the design process, as well as the experience of the resulting artifact (participation, pluralism, plurality).  (source) |
  (source)
2.3 Feminist Digital Humanities
In terms of visualization work, gender – especially as it relates to issues of authorship and style – has long served as a subject of DH research, e.g. [46].  (source) However, the visualizations that accompany such analyses almost always employ standard representational techniques [45]. Recently, Miriam Posner [65] identified the development of new visual strategies for the representation of non-binary gender as one of the most pressing challenges of DH today.
 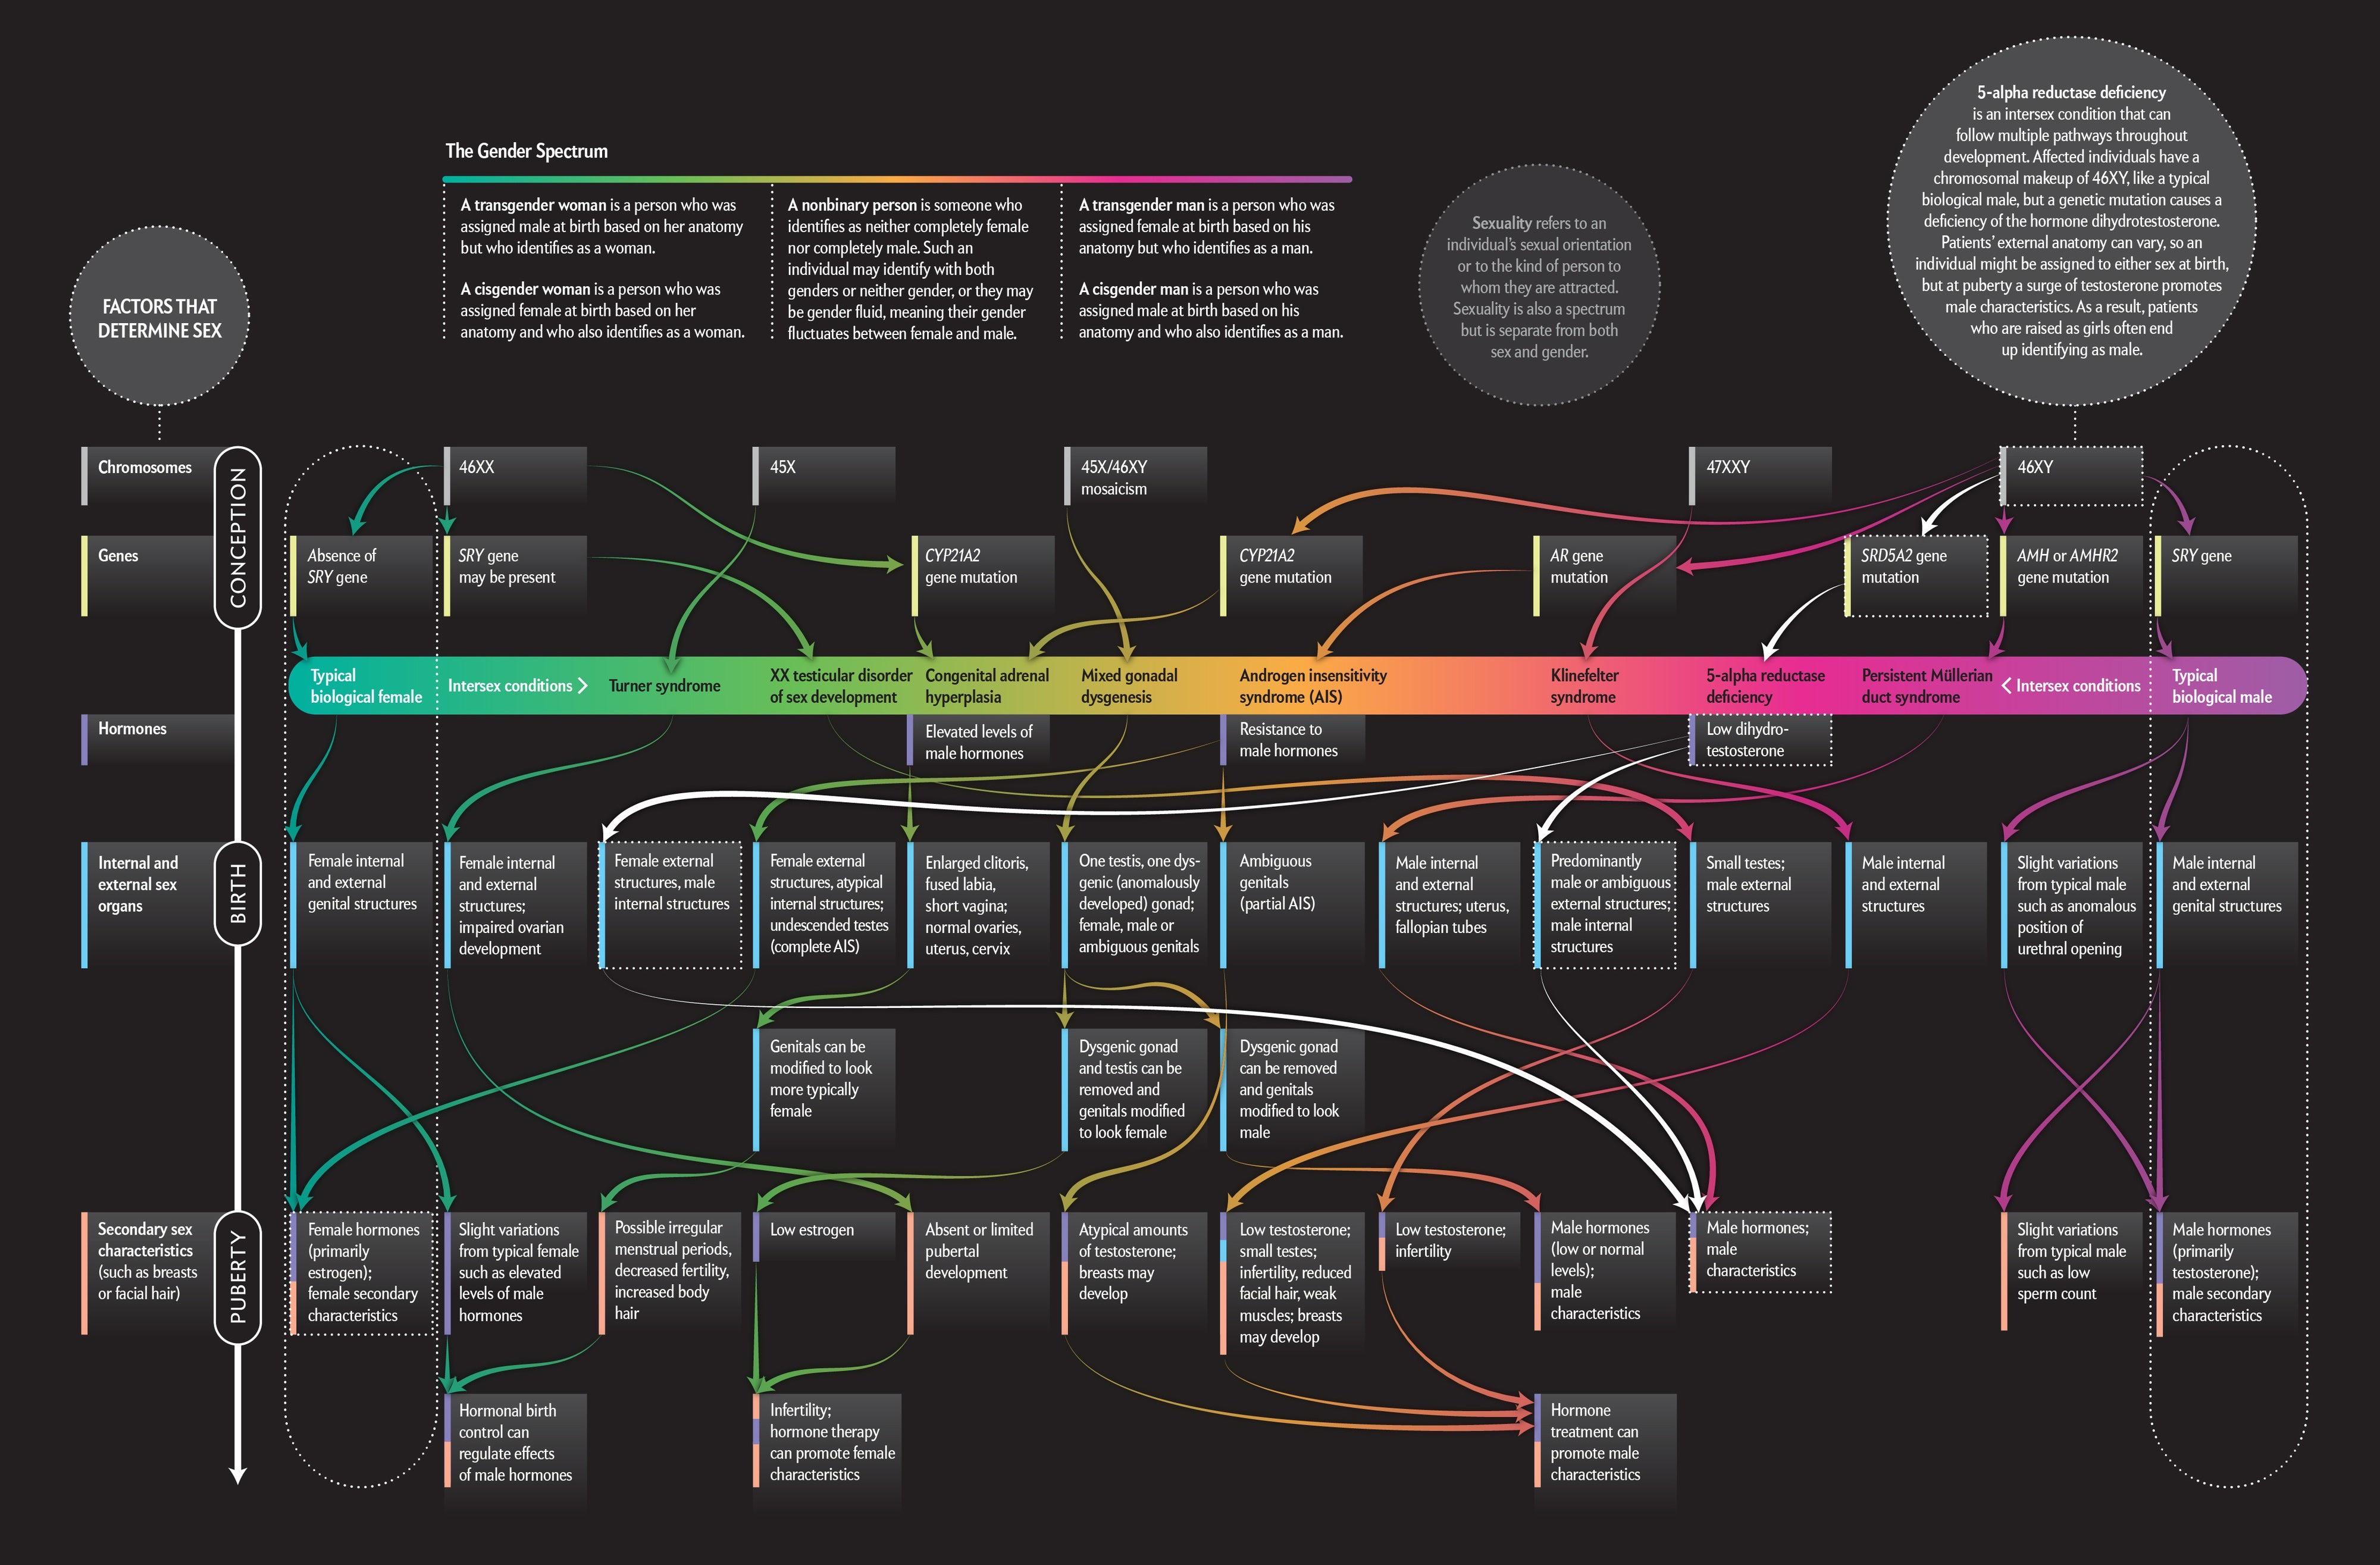 (source)
2.4 Critical Cartography & GIS
Cartographers such as JB Harley challenged the perceived neutrality of the map and introduced notions of ideology and bias [40, 41]. While he did not explicitly draw on feminist theory, Harley argued for the situatedness of maps as historically and culturally contingent documents. During the same period, Denis Wood connected maps explicitly to the rise of the nation-state and showed how maps serve political interests [82]. Other scholars linked Geographic Information Systems (GIS) to an impoverished techno-positivism [64] and militarism [71]. Subsequent scholarship theorized the map more as rhetorical proposition than depiction of “fact” [81]. 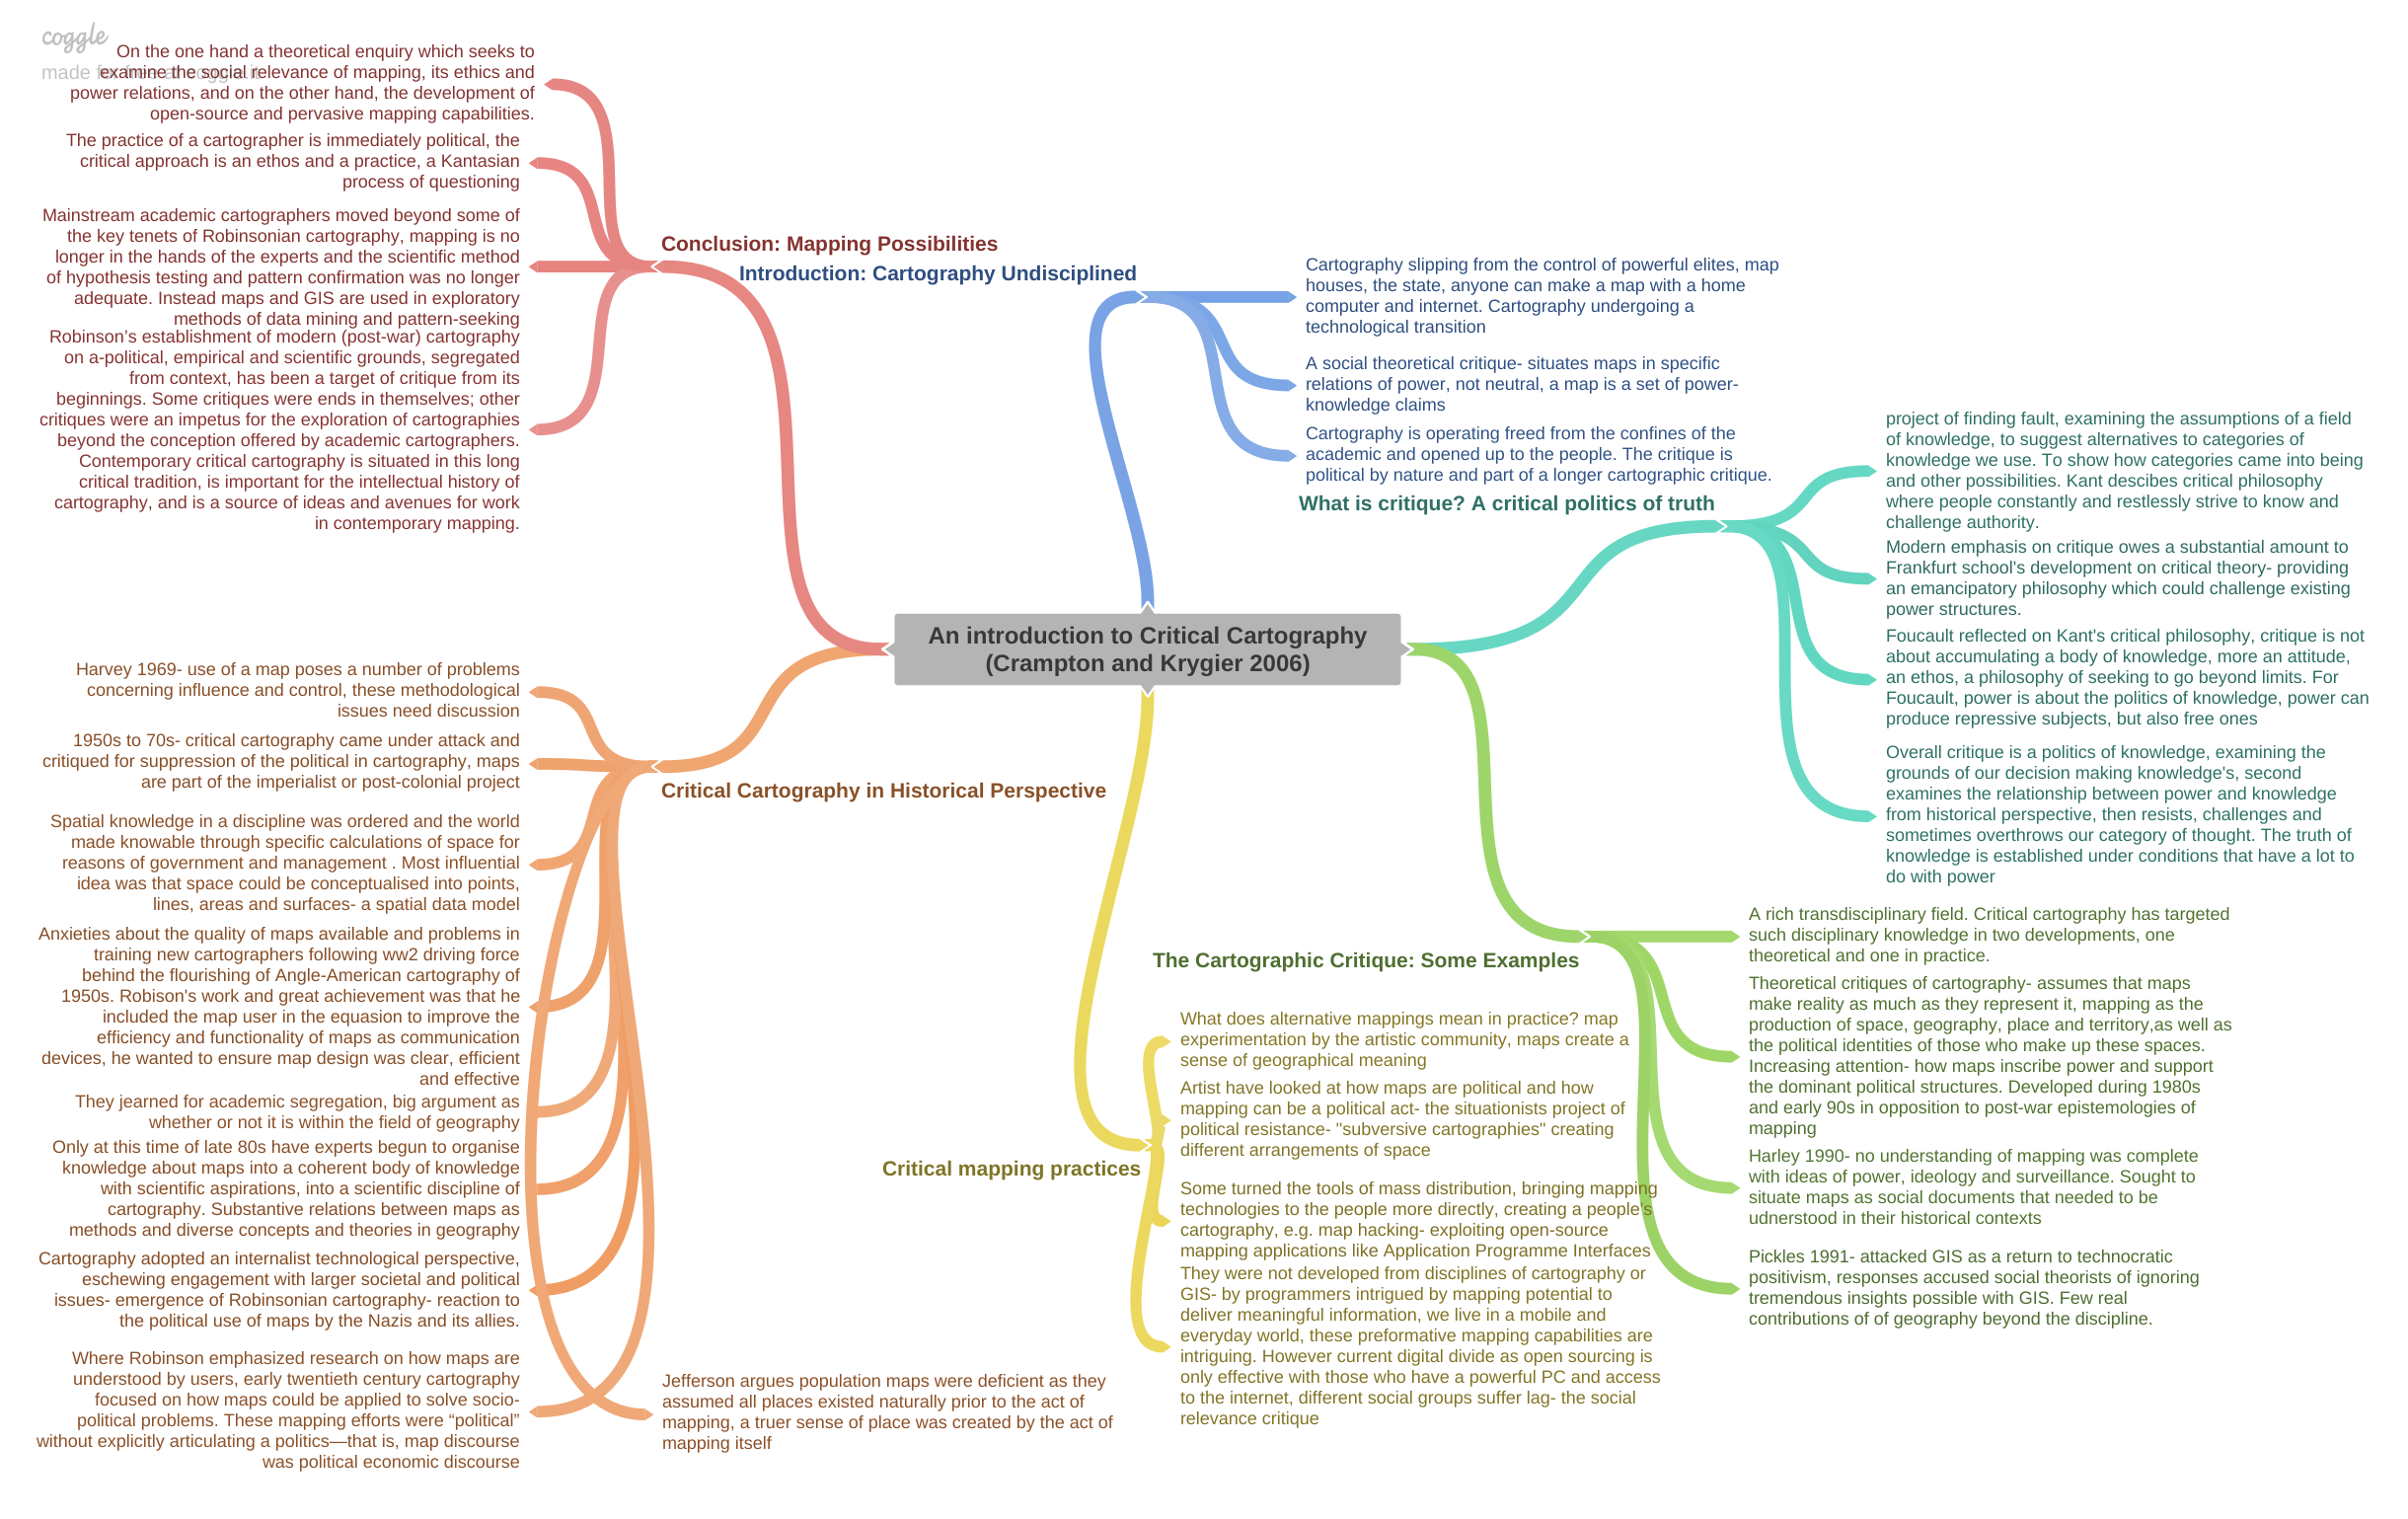 (source)
3 PRINCIPLES OF FEMINIST DATA VISUALIZATION
3.1 Rethink Binaries
Central to feminist theory is the disavowal of binary distinctions– not only between the categories of male and female, but also between nature and culture [37], subject and object [43], reason and emotion [54], and body and world [4], among many others. A feminist approach to data visualization should therefore emphasize representational strategies premised on multiplicity rather than binaries, and acknowledge the limits of any binaristic view [53].
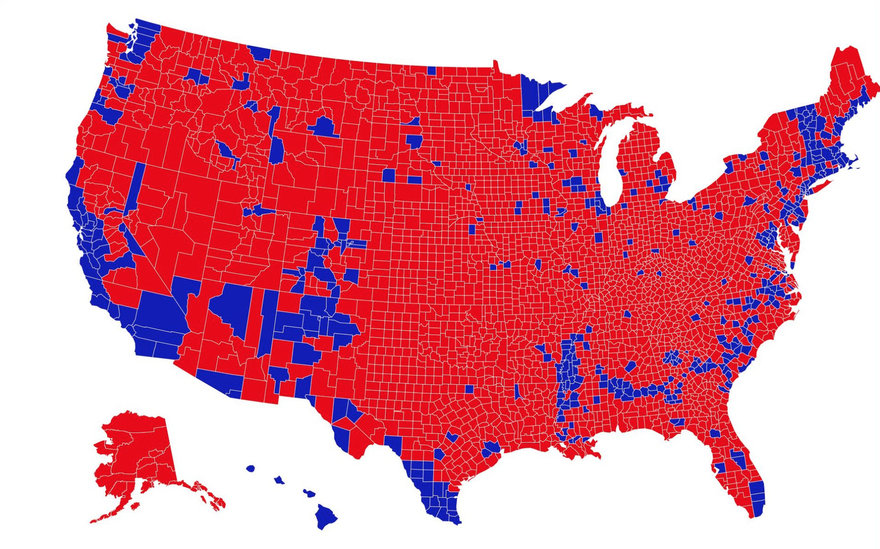
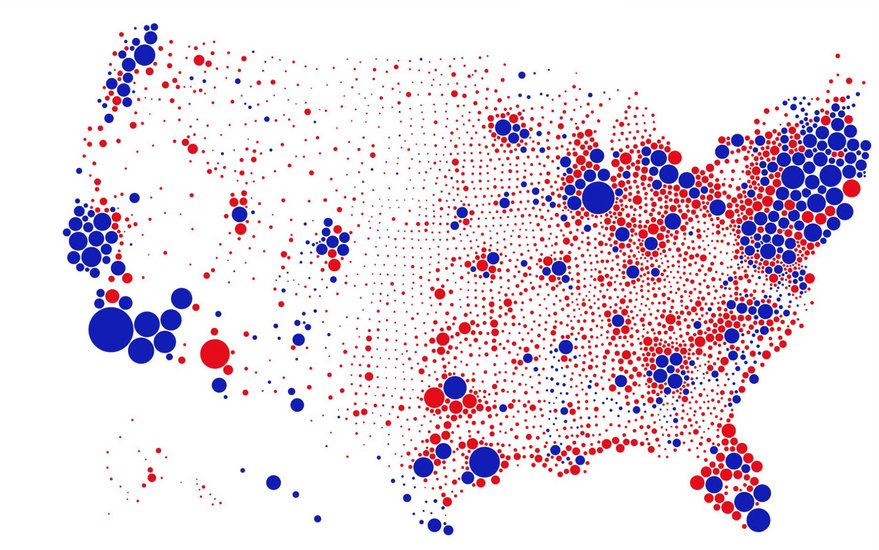
 Revenge mapping: still polarized (source)
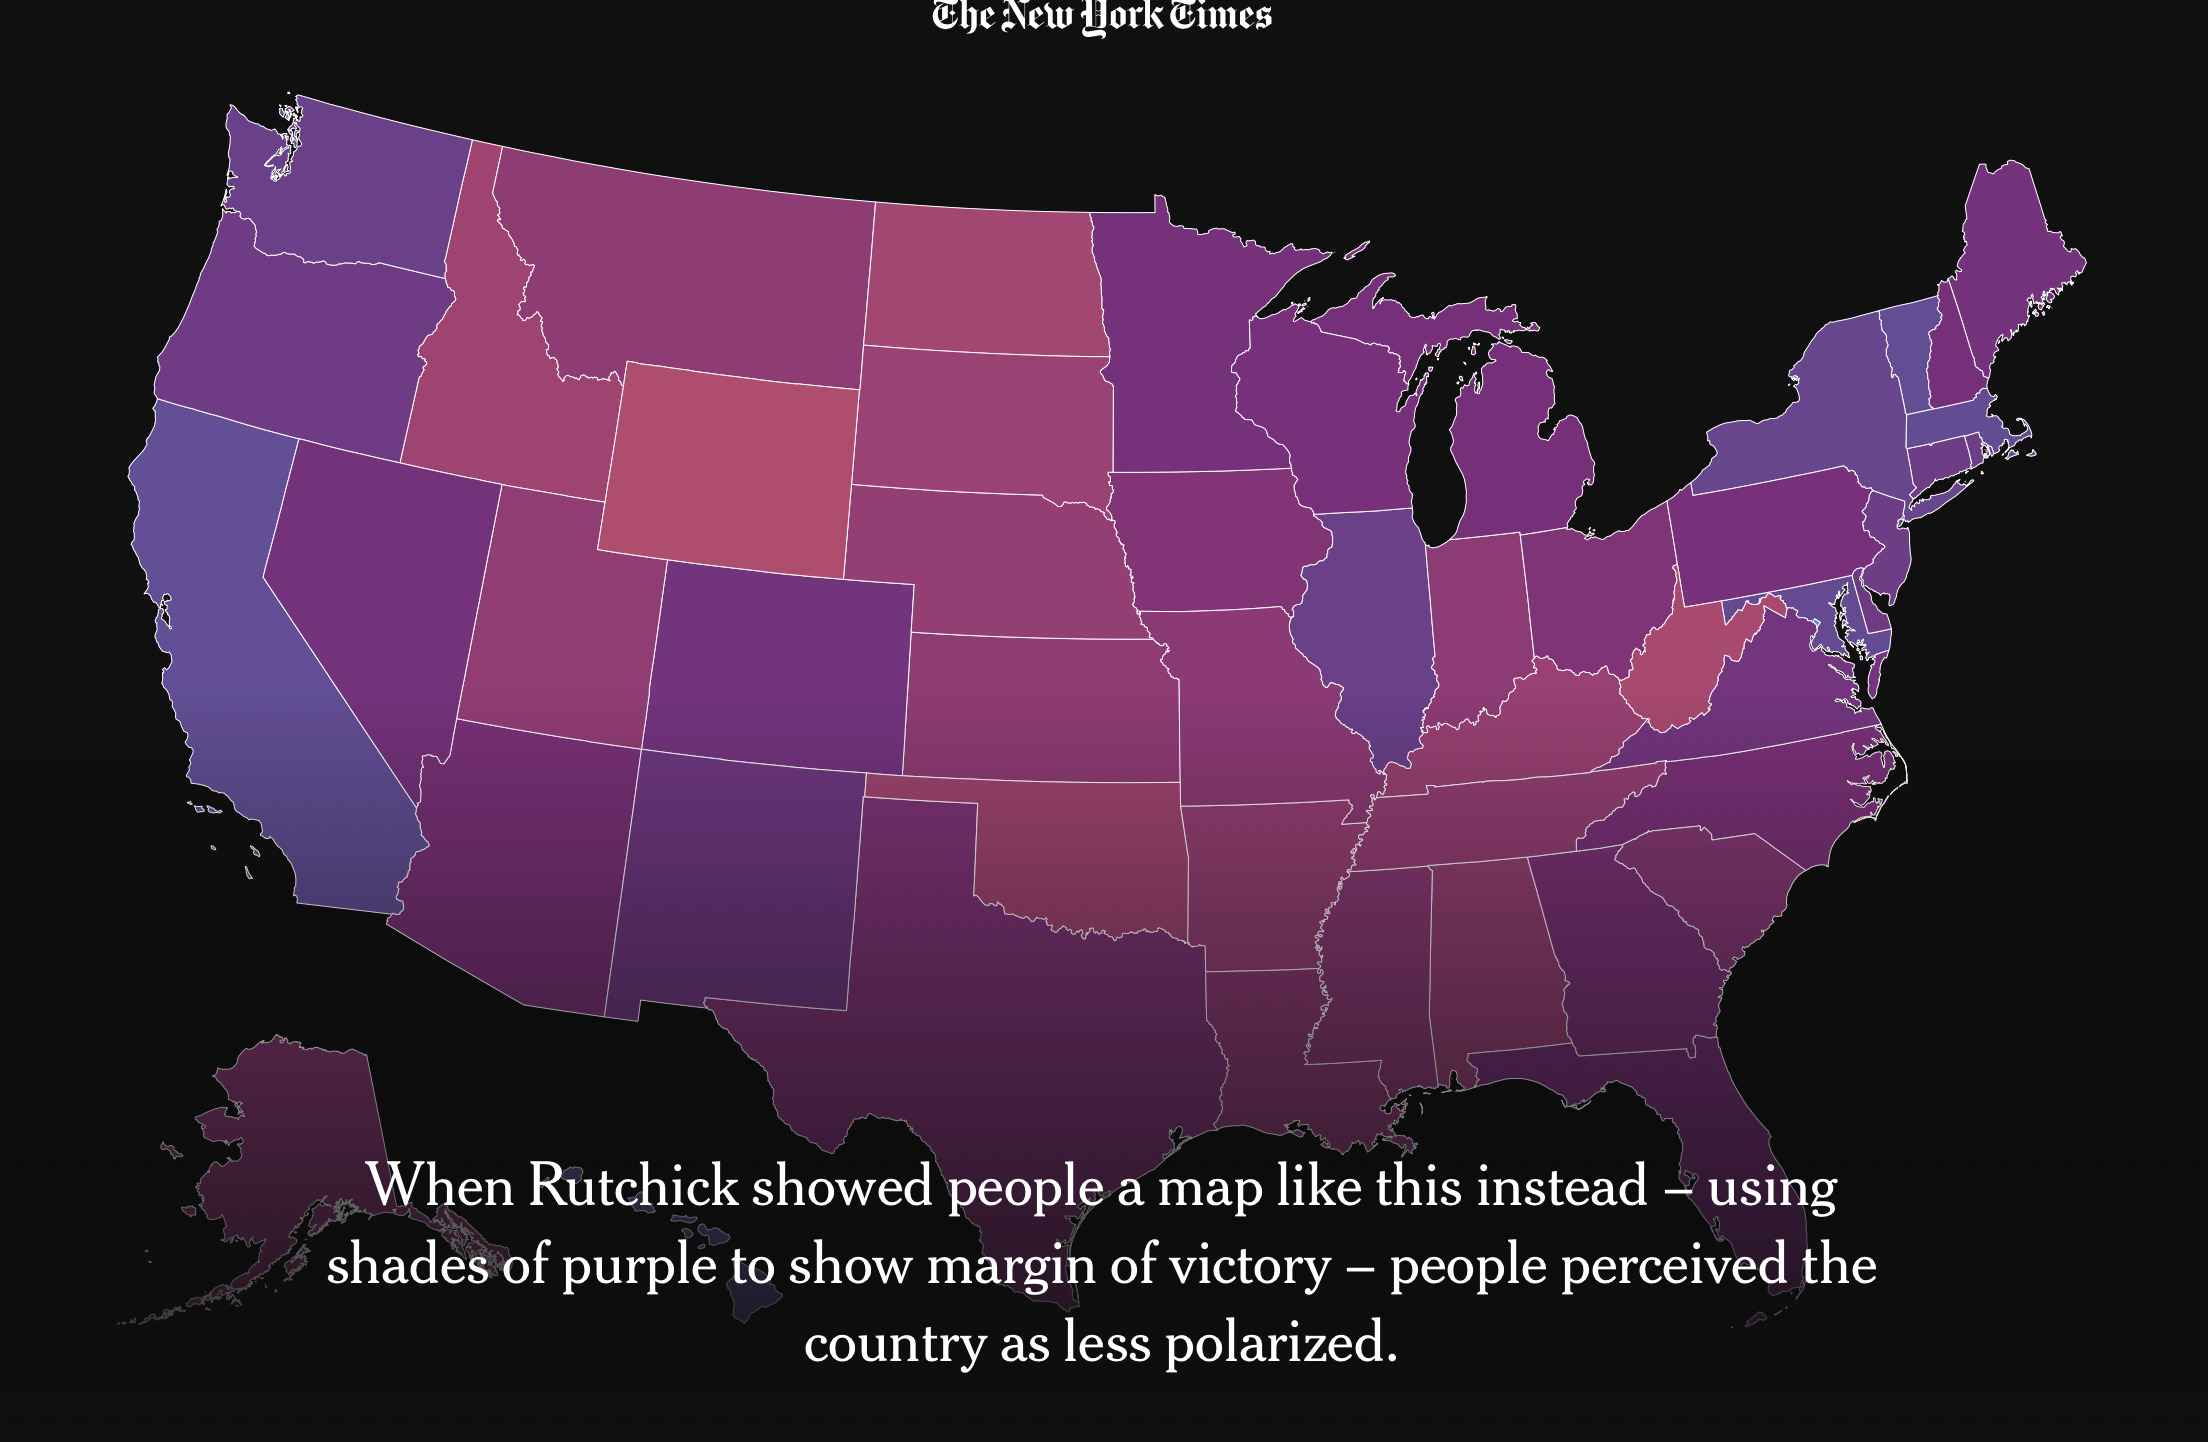 Red and blue and purple and polarization (source)
Not only a challenge for the visualization phase of research, rethinking the representation of gender, among other binaristic categories, challenges us to inquire how the processes associated with data collection and classification, as well as their visual display, might be made to better account for a range of multiple and fluid categories.
Design Process Questions: Is our data the right type? What categories have we taken for granted? How can we register responses that do not fit into the categories we have provided, even and especially if they are “edge cases” and “outliers”?
Design Output Questions: How do we communicate the limits of our categories in the final representation? How can we allow the user to refactor the categories we have presented for view?
3.2 Embrace Pluralism
Feminist theory seeks to challenge claims of objectivity, neutrality and universalism, emphasizing instead how knowledge is always constructed within the context of a specific subject position [8, 38, 39, 54].  (source) In the context of data visualization, a focus on the designer’s own subject position can help to expose the decisions, both implicit and explicit, that contribute to the creation of any particular visual display.
Ideally, a focus on pluralism would help visualization research move away from its current emphasis on “objective” presentation in favor of designs that facilitate pathways to multiple truths.  (source)
Design Process Questions: Whose voices are not represented on the design team but might be important for the conceptualization of the project? Who is being envisioned as the ideal user? How could additional perspectives be accommodated, even those considered marginal? Whose perspectives have been excluded from the categorization schema? For example, collecting gender in female/male buckets excludes transgender, gender-fluid and two-spirit people.
Design Output Questions: Can the artifact communicate the subject positions of the researcher(s) and designer(s) in a transparent way? Whose view of the world does the visualization represent?  &
&  (source) Can the visualization communicate whose voices are missing?
 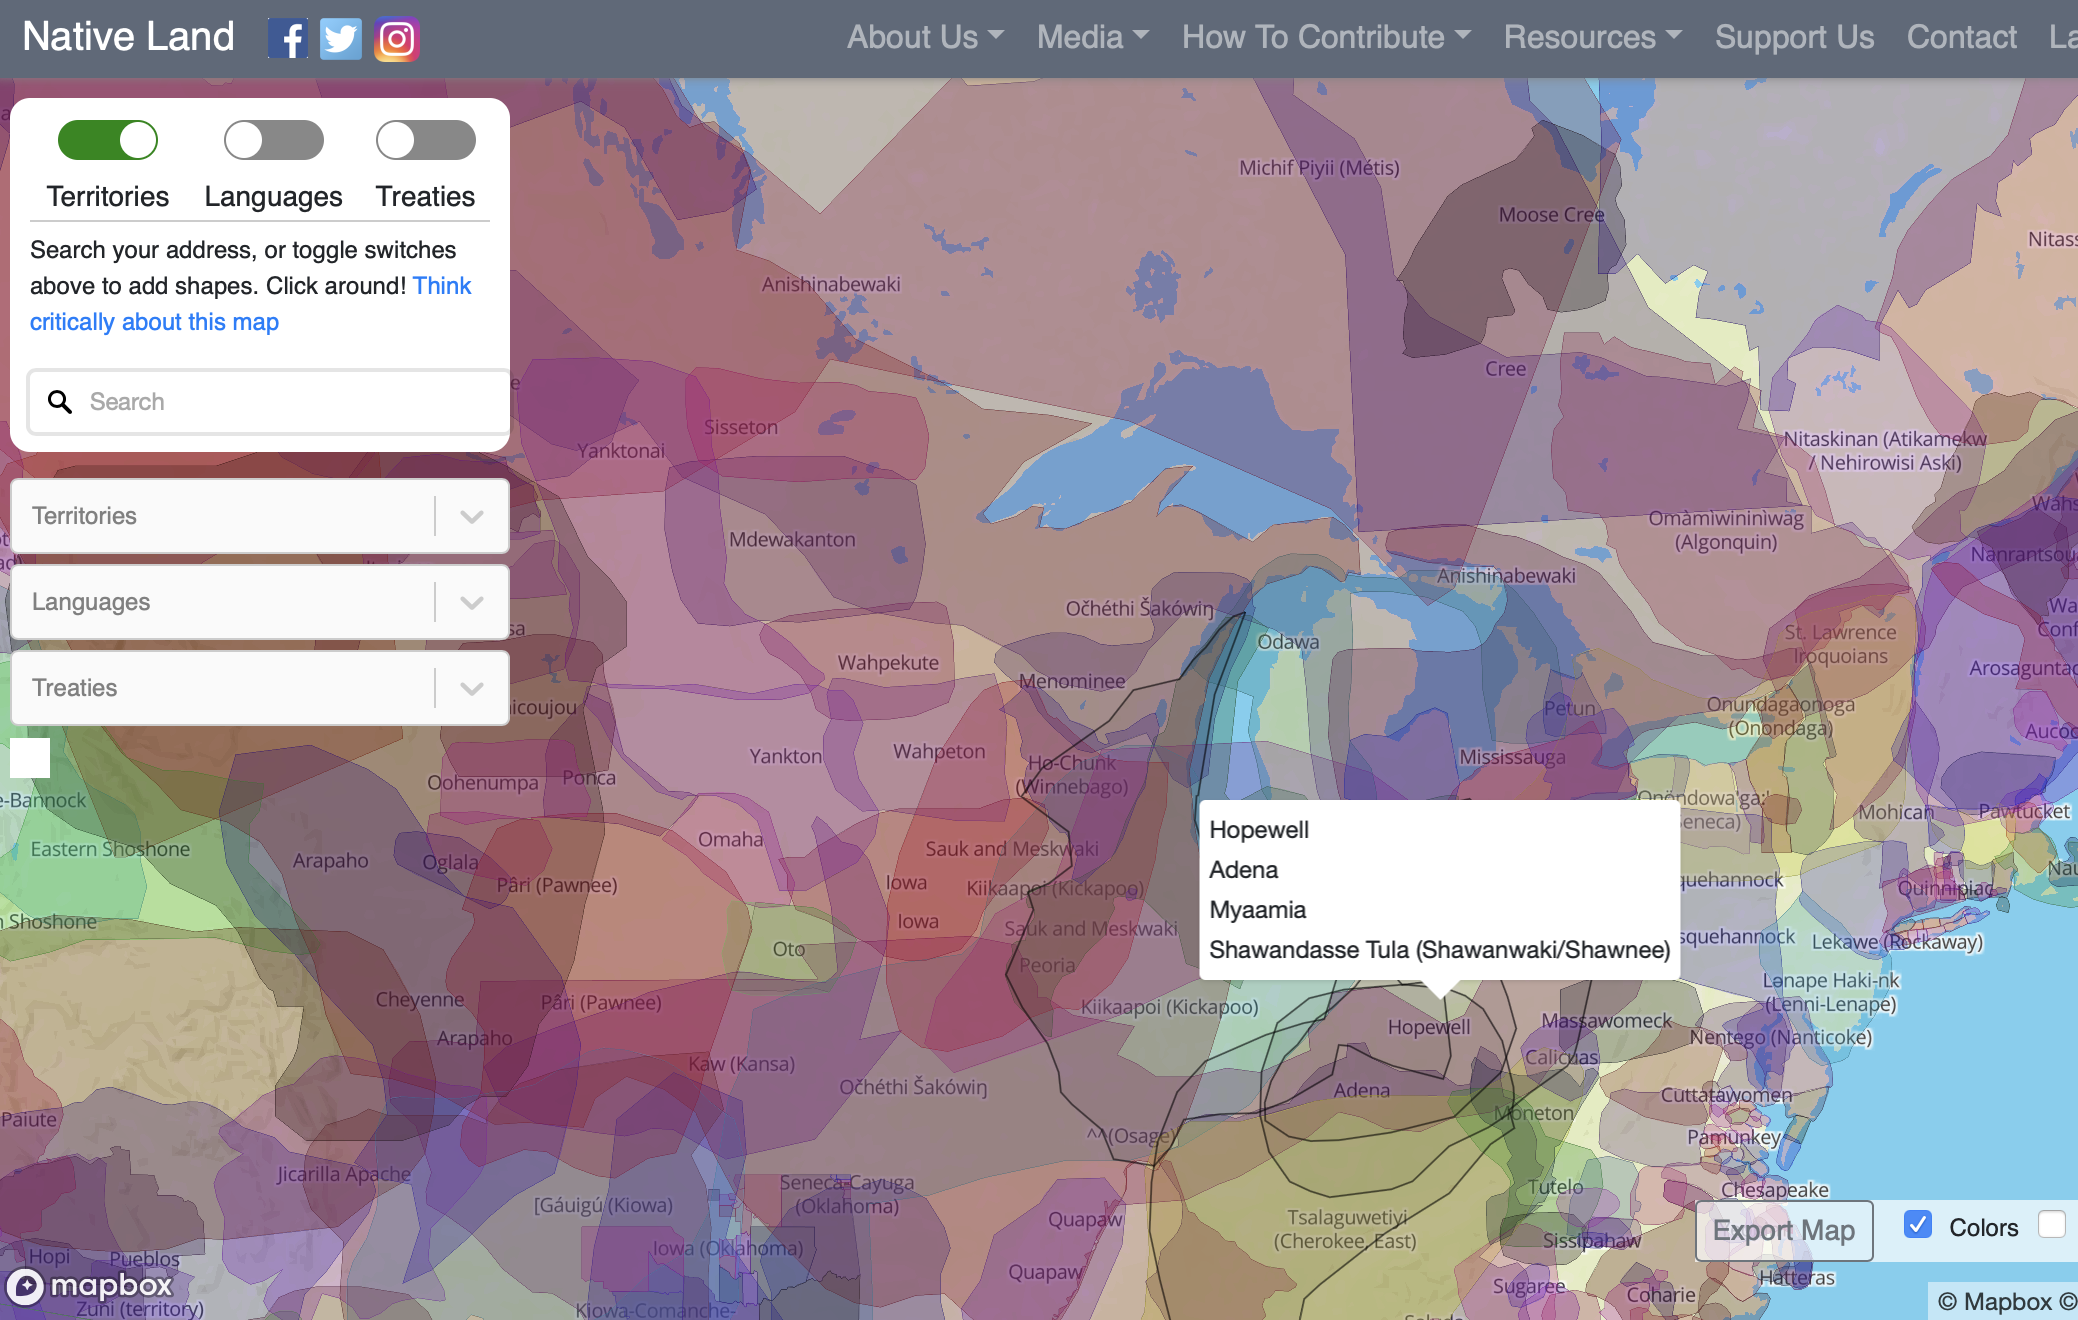 (source). Could perspective-taking be a useful strategy to consider for multiple views on the data?
3.3 Examine Power and Aspire to Empowerment
A feminist approach to data visualization therefore acknowledges the user as a source of knowledge in the design as well as the reception of any visual interface. The creation of knowledge is, after all, always a shared endeavor.
Aspiring to empowerment, then, may involve designing for and evaluating the success of a visualization at the scale of the community rather than the individual user.
Design Process Questions: How is power distributed across the design team? Whose voice matters more and why? How can end-users’ voices be more fully integrated into the design process? Can we build capacity in user communities, or enlarge our internal perspectives, by employing a more participatory design process?
Design Output Questions: Can the visualization empower the end-user and/or her community, group, or organization? 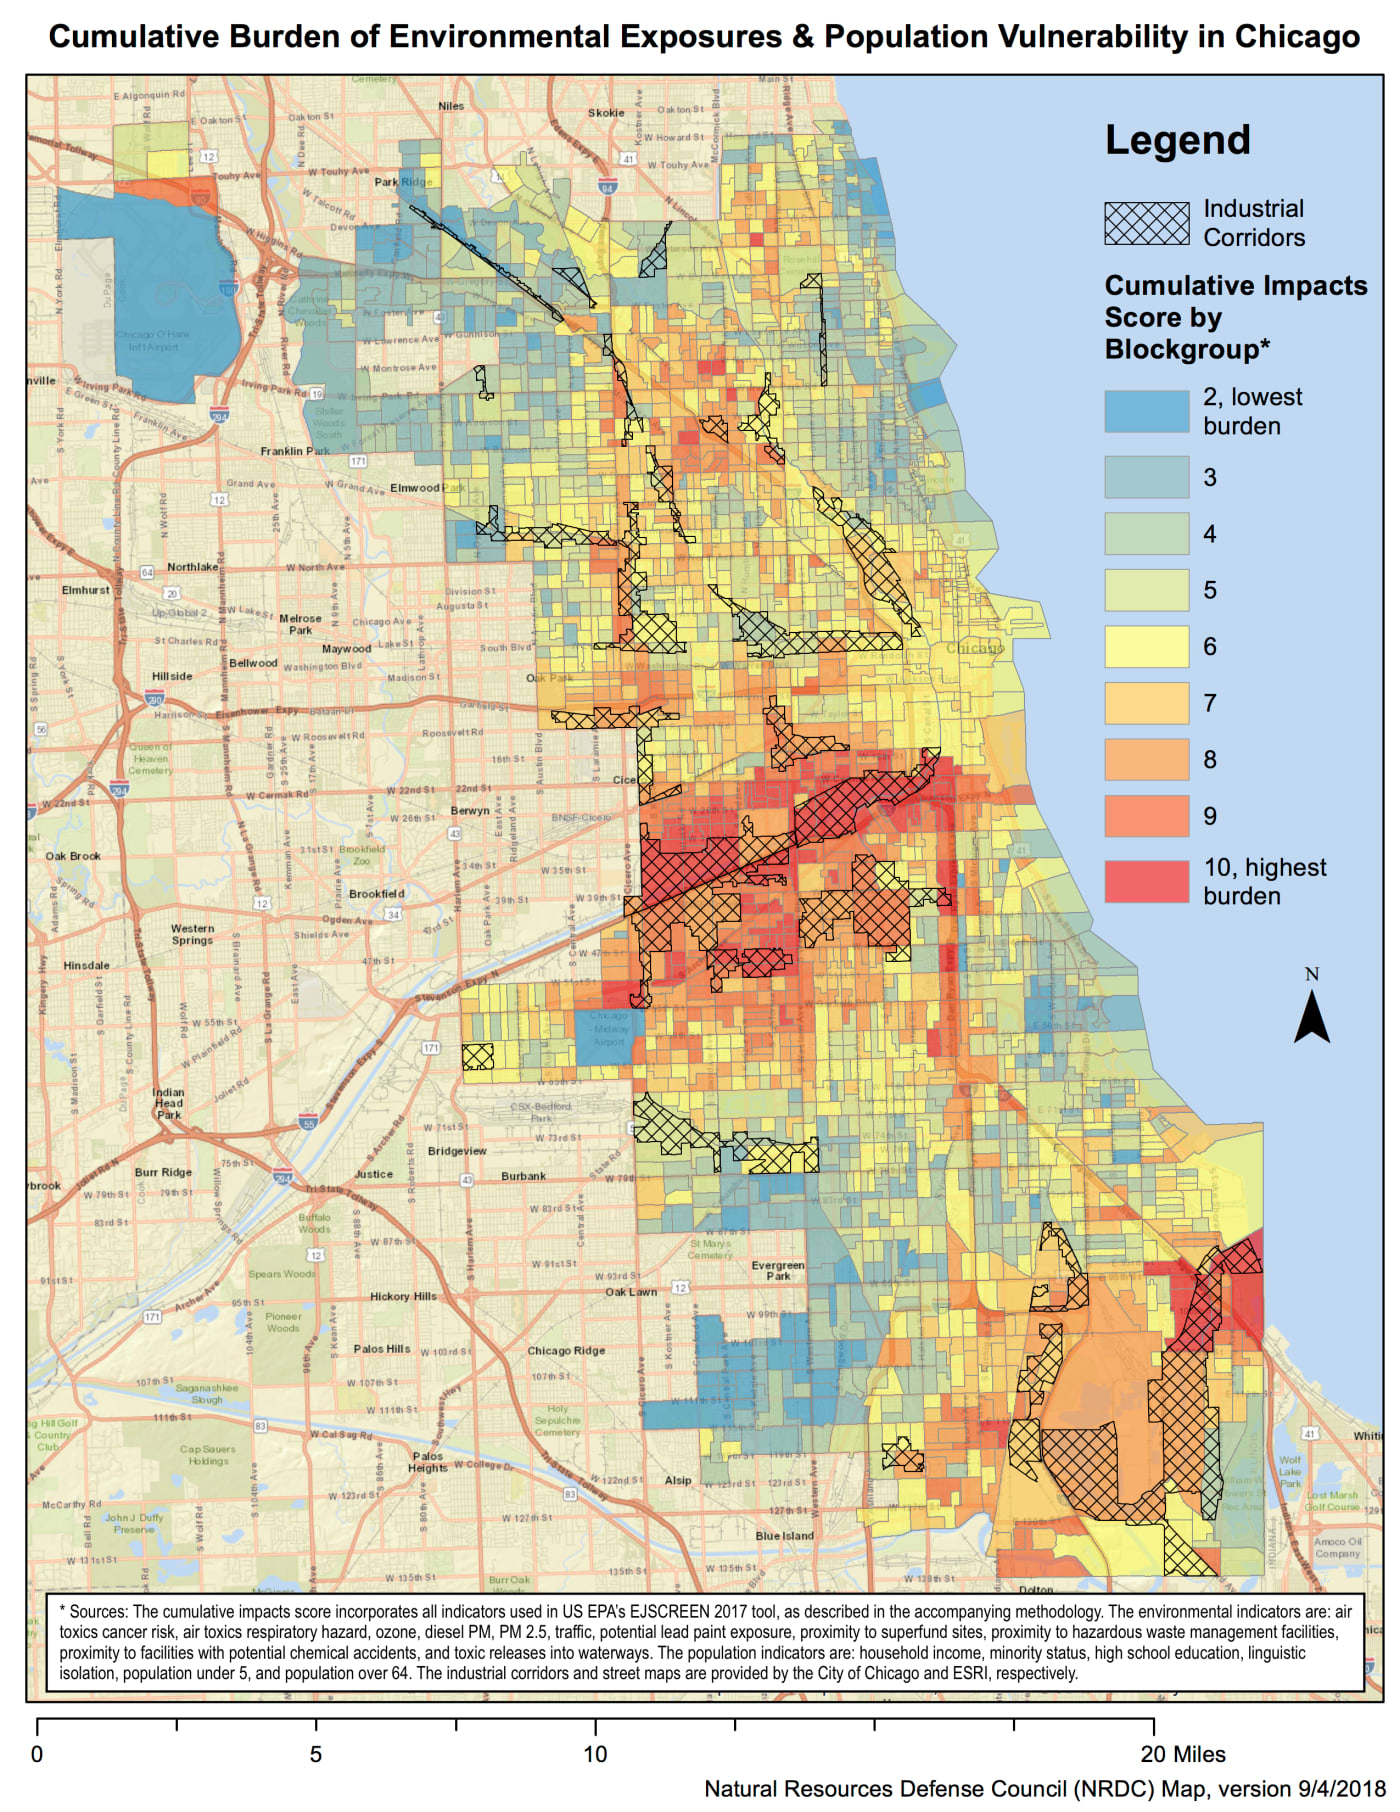 (source) &
  (source). When do values often assumed to be a social good, such as “choice,” “openness,” or “access,” result in disempowerment instead?
3.4 Consider Context
A central premise of feminist theory is that all knowledge is situated [36], where “situated” refers to the particular social, cultural, and material context in which that knowledge is produced [33]. A feminist approach to data visualization must therefore consider how diverse contexts can influence the production of a visualization, and think through the various ways in which any particular visualization output might be received. 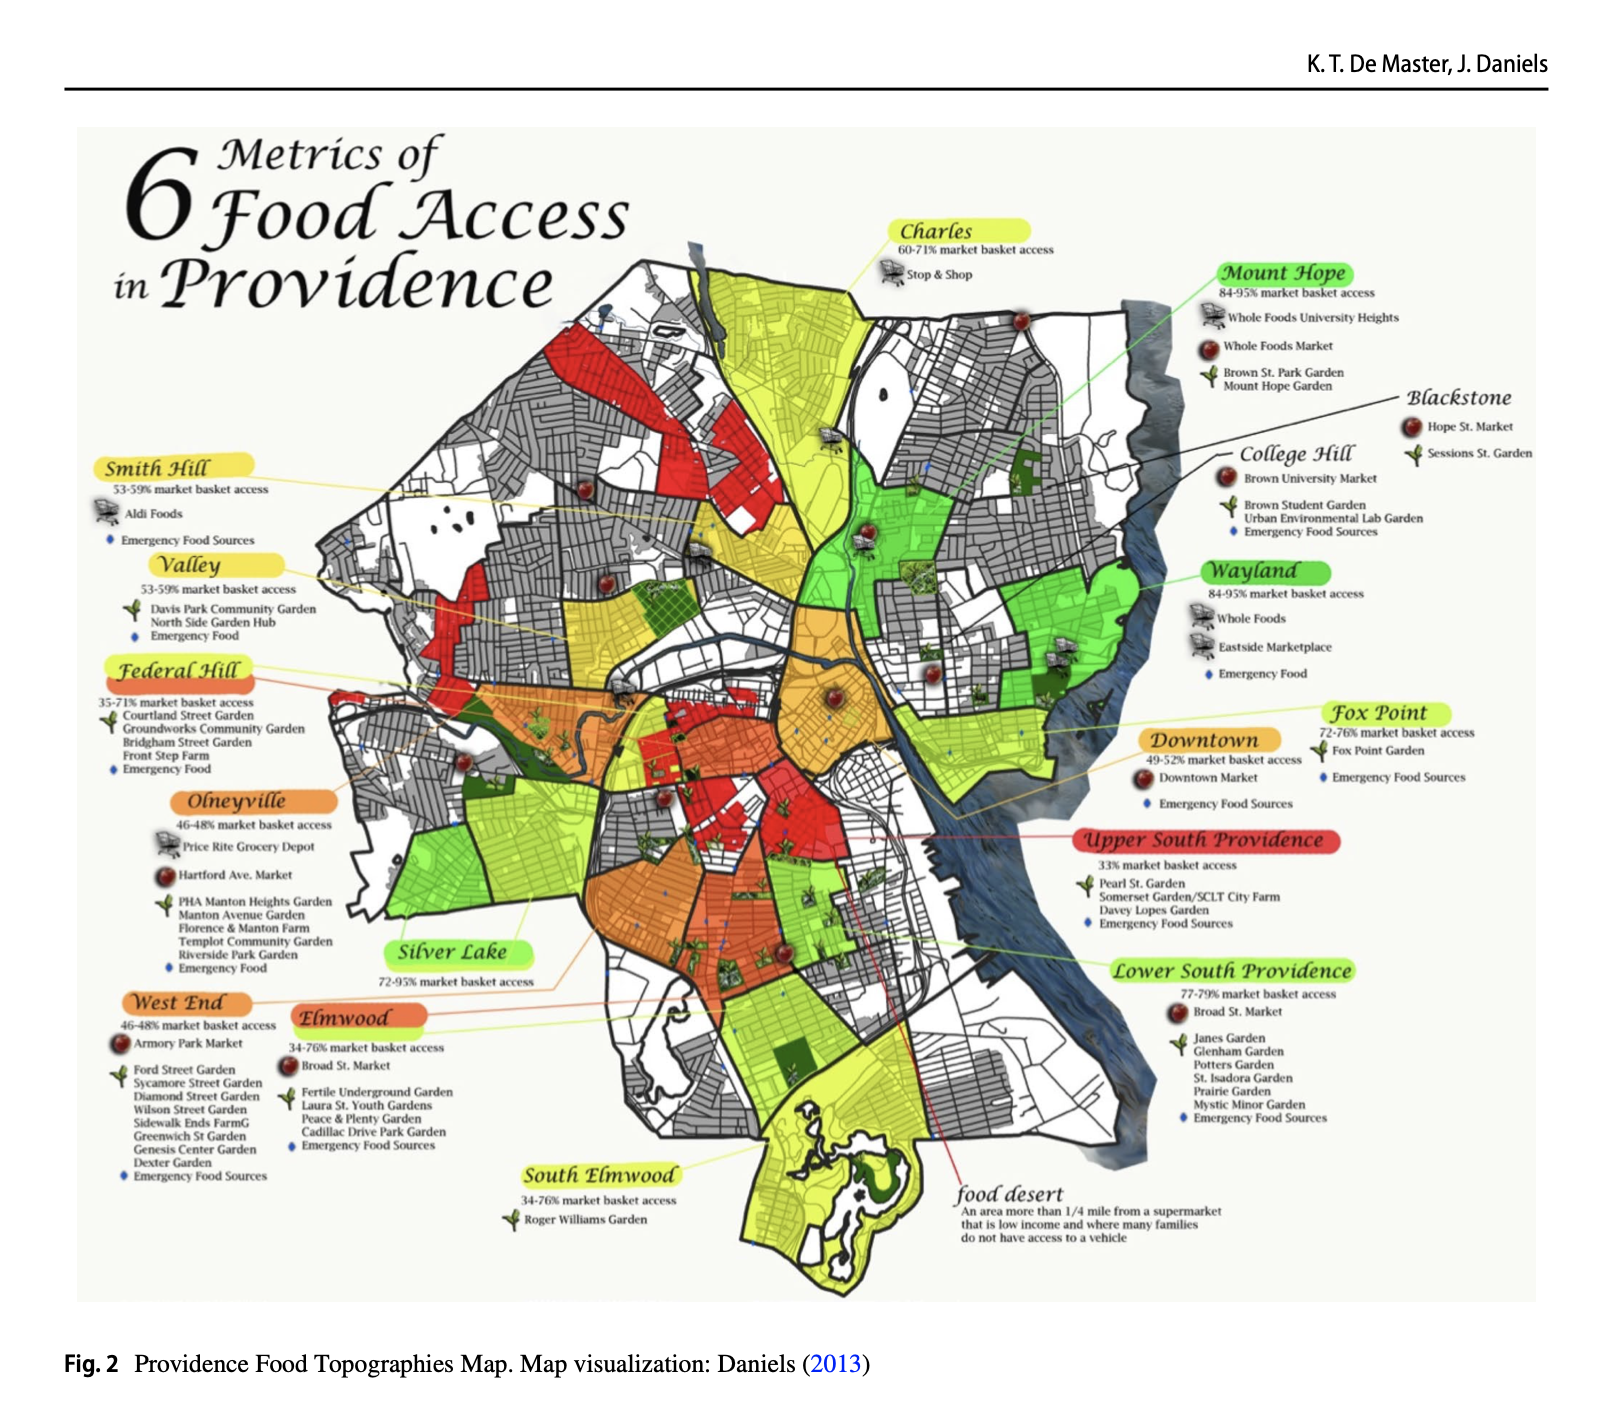 (source)
Design Process Questions: How can we leverage human-centered design [14] and participatory design [72] methods to learn about and with our end-users, including learning more about their culture, history, circumstances, and worldviews? How can we let these insights shape our design practice and change our notions about what constitutes “good” information design?
Design Output Questions: What kinds of terminology, symbols, and cultural artifacts have meaning to end-users, and how can we incorporate those into our designs? What might we learn if we were to visualize “messy” data [68]? How do we take context into account in the assessment of visualizations?
3.5 Legitimize Embodiment and Affect
Feminist theory recognizes embodied and affective experiences – that is, experiences that derive from sensation and emotion – as ways of knowing on par with more quantitative methods of knowing and experiencing the world [13]. 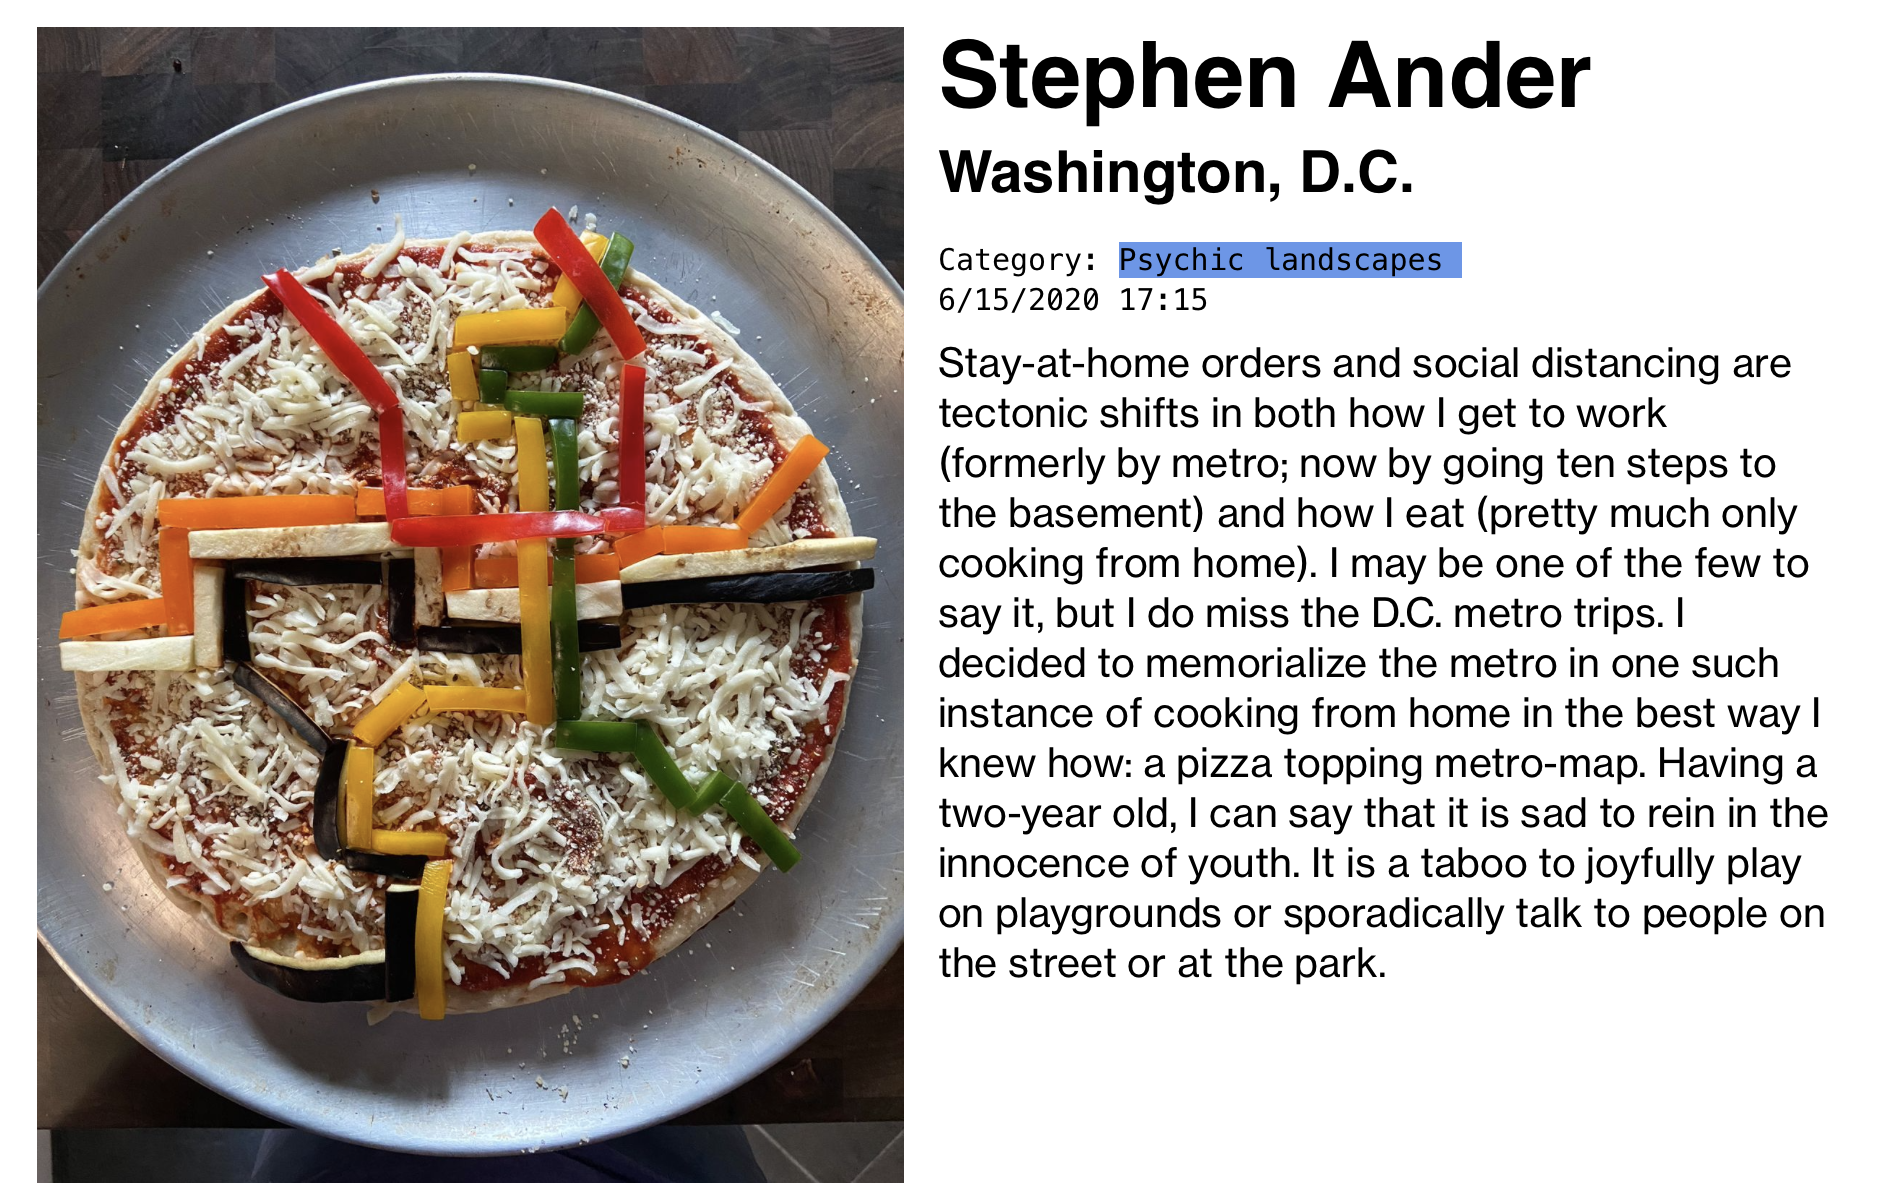 (source). By definition, visualization rests on the production and assimilation of visual knowledge. But even the most efficiency-oriented and task-driven visualizations have embodied and affective impact, if only to communicate their utility, economy, and purposefulness by way of the visual domain.
Design Process Questions: How can we leverage embodied and affective experience to enhance visualization design and engage users? 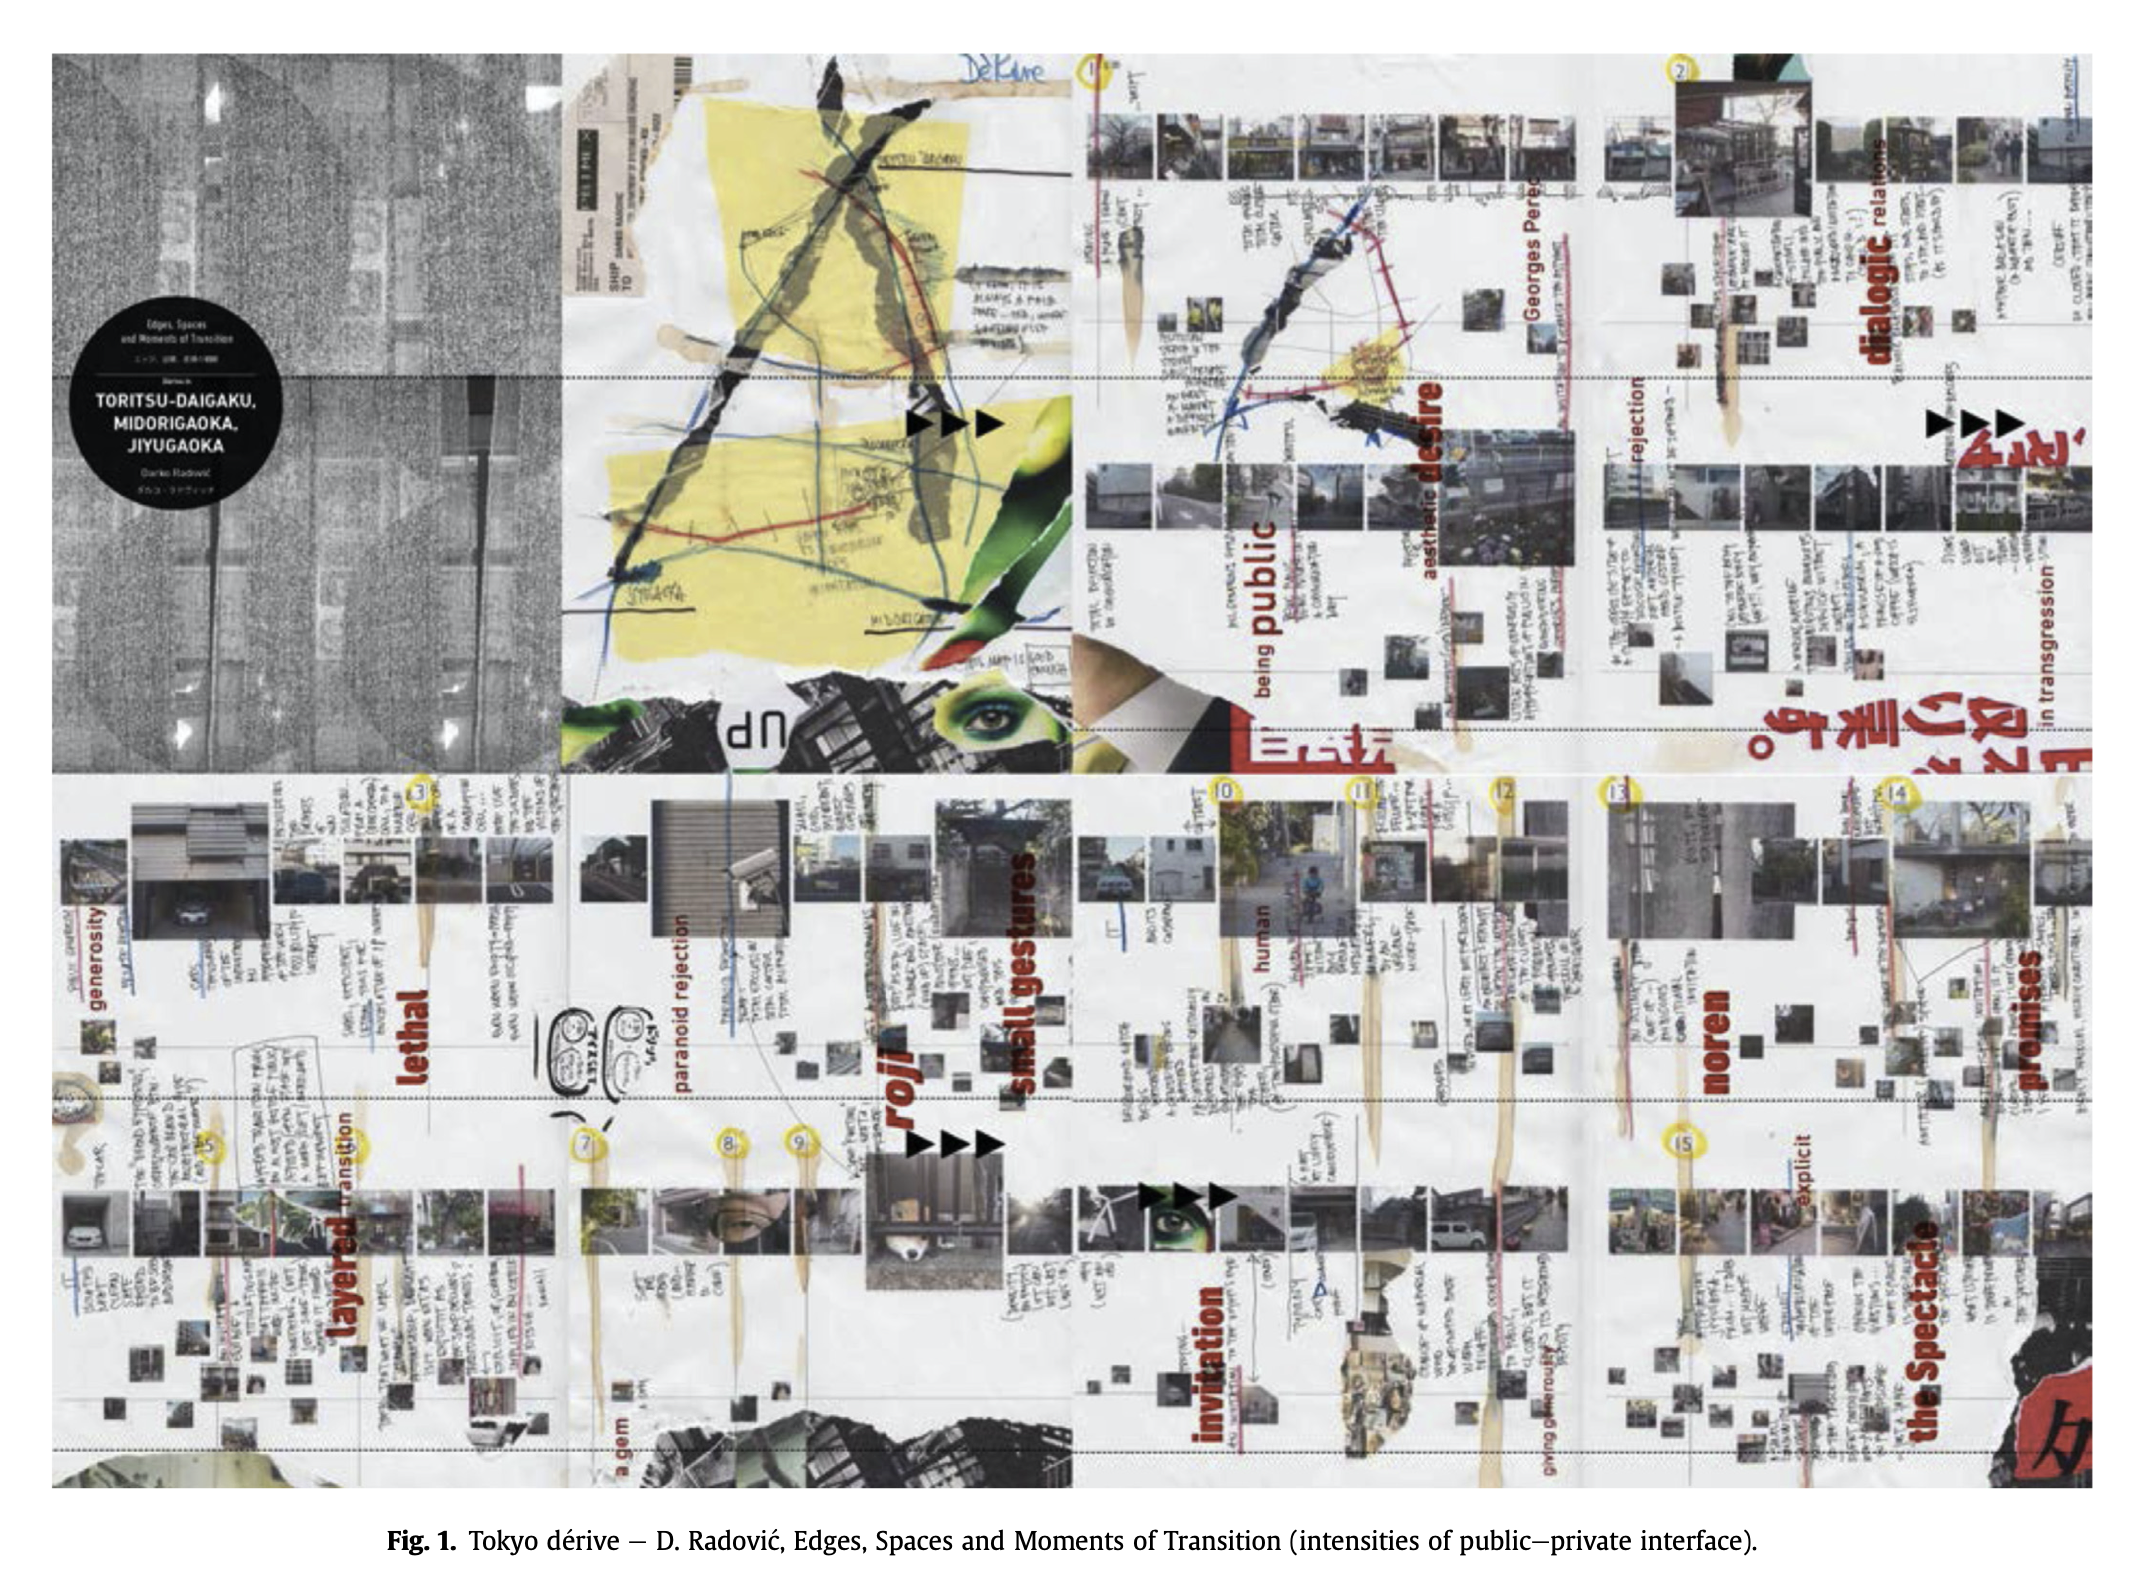 (source) &
 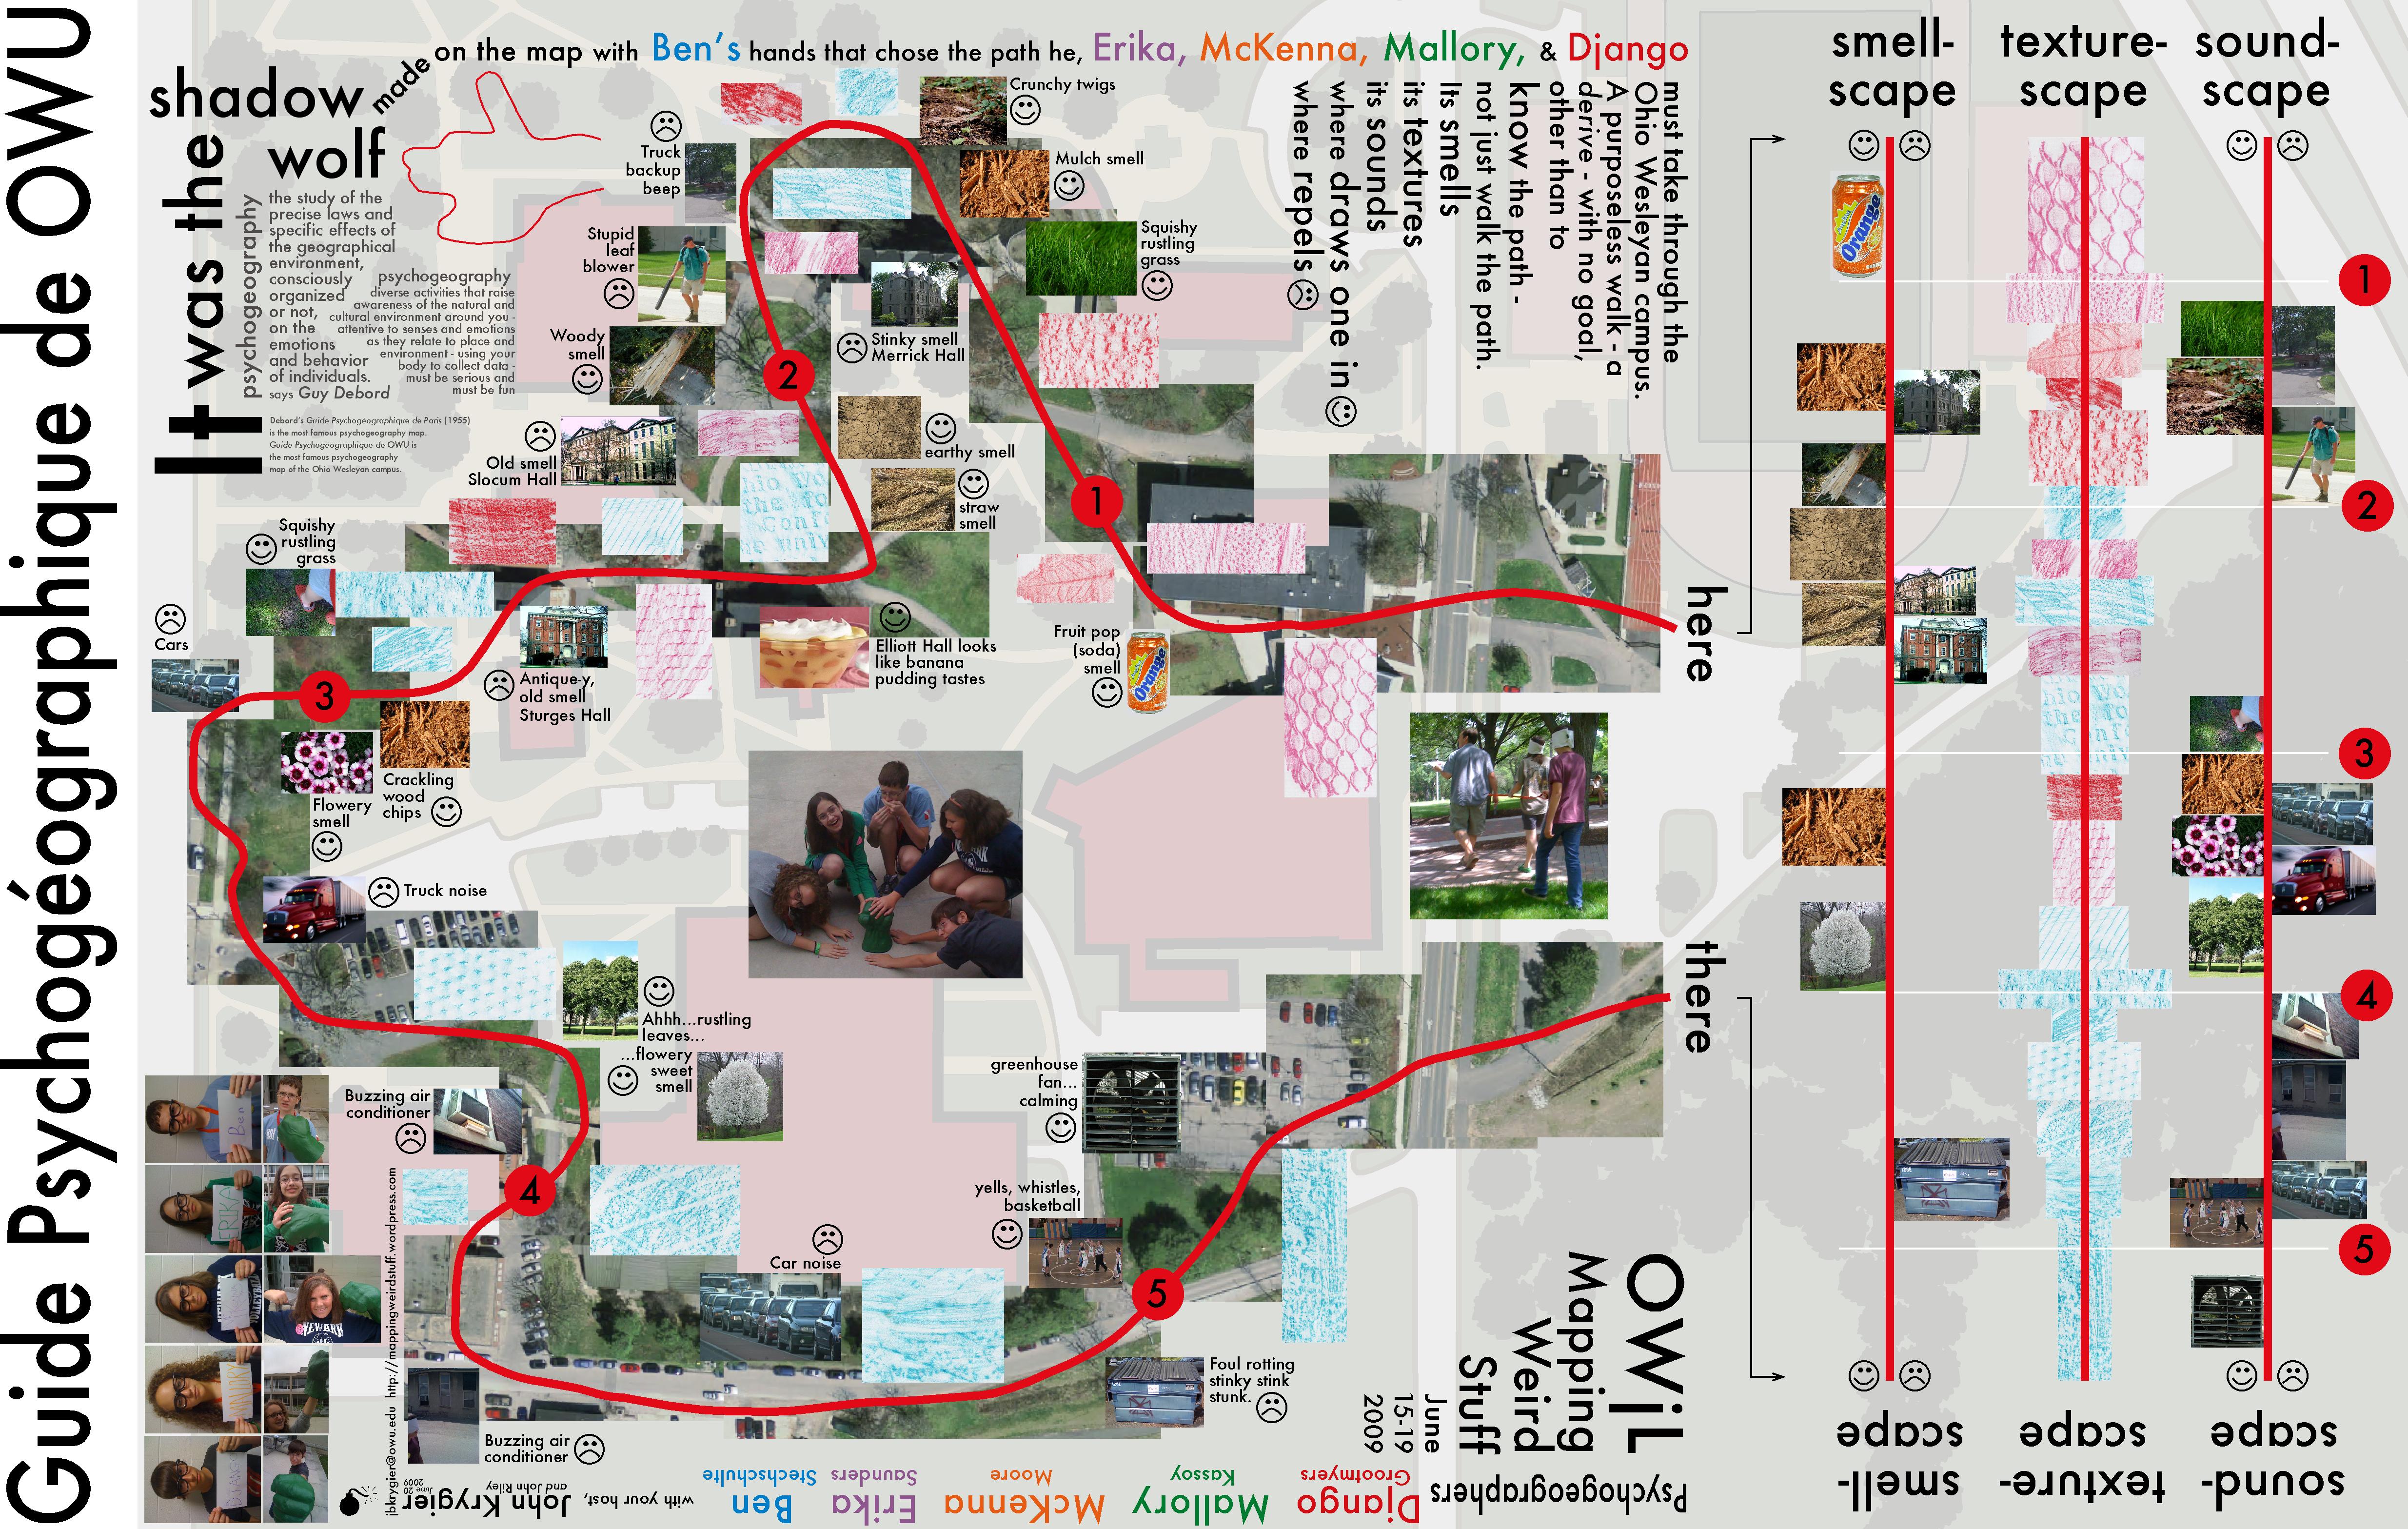 (source). What kinds of expertise might we need on our design team in order to do that? (e.g. fine art, graphic design, animation, or communication specialists)
Design Output Questions: What kinds of embodied and affective experience has meaning to end-users? Should we consider tactile, experiential, or social ways of accessing the data visualization? Can we consider visualization outputs in an expanded field, such as data murals [7], data sculptures [1], public walks [2], quilts [48] and installations [63]?
3.6 Make Labor Visible
Information design processes often start with data, but a feminist approach would insist that they begin by working backwards to surface the actors (both individual and institutional) that have labored to generate a particular dataset.
Design Process Questions: Can the team work backwards from the given data to document their provenance and talk to their caregivers? Has the team discussed roles, responsibilities, and credit in advance of publication?
Design Output Questions: Is it feasible to provide a metadata visualization that shows the provenance of the data and their stakeholders (caregivers) at each step? Have we properly attributed work on the project?


Applying feminist theory to mapping and GIS may seem weird, but it correlates with some of the broader issues we have been engaged in the class, including the entire idea of crowdsourcing (it’s non-hierarchical, pluralistic, empowering, and so on) as well as the web GIS technologies, which embrace some of these ideas at their core.
“Feminist Data Visualization” by Catherine D’Ignazio and Lauren F. Klein was a preface to a book that was published last year called Data Feminism. We will read and discuss the former, but I’ll include some details from the latter below.
“Feminist Data Visualization” PDF here.
Data Feminism book information here.
Ponder these questions, look up citations, and google stuff: examples are always good:

For week 11 we shall finish the Making Maps book with four presentations on Monday:
For Wednesday, let’s have Ch. 4 of the Getting to know WebGIS book done. I say some somber words about that fine chapter.
Please chime in with updates on your project ideas if you have not already done so.
For next week: some more fun stuff to read and do:
Week 12: WebGIS: Tile Layers
Read / Complete: PF ch. 5 & “Feminist Data Visualization“
Monday, Nov. 2: Discuss: PF Ch. 5 Tile Layers
Wednesday, Nov. 4: Discuss “Feminist Data Visualization” by Catherine D’Ignazio and Lauren F. Klein (also here) and come up with examples from mapping / GIS / web mapping that apply to the six principles. For example, Google: map cartography affective

For this week, beyond bumping through four more chapters of the Making Maps book on Monday, lettuce take a look at a paper called Desert Wonderings.
Here is a copy of the article with some of my highlighting, if you care
Put some notes and comments and questions in your weekly blog posting.
Be ready to say something about these ideas in terms of the paper – and the idea of food deserts and food desert maps – and your class project (which might be more of an effort!)
In this reading, and discussion, we are putting a real-world case together with the mapping: which is the way it should be.

Just a few additions to the announced changes to the schedule (see previous post):
Monday, October 12: 1 paragraph draft of course project idea (discuss in class)
Wednesday, October 21: Revised course project proposal (post to blog)
Wednesday, October 21: Read and Discuss “Desert Wonderings”

Geography 353, like 2020 in general, keeps stumbling along, headed in a direction that has now altered a bit.
I’ve updated the course Schedule and Evaluation pages. Pooray.
For this week:
Week 8: Course Project & Rest of Semester
Monday, Oct. 5: Work Day!
Wednesday, Oct. 7: Brief Presentations of Progress (PF Ch. 1 -3) & Course Project & Rest of Semester
Monday, October 5: Since I’m getting this update to you a bit later than I expected (my Dr. said chill out! I did. Sorry) let us have another workday on Monday. As usual, I’m nappy to meet on Zoom or email if you have questions.
Wednesday, October 7: I’d like to hear from all of you, summarizing your efforts to read and complete the tutorial work in Getting to Know WebGIS chapters 1-3. Then I’d like to talk about the Course Project and the rest of the semester.
Course project: I am going to scale this back as several project ideas that I had planned have fallen through. I’d like you to undertake your own project using the WebGIS stuff you are learning in the book. This can be just about anything. A few of you had ideas expressed earlier in the course.
Alternatively, look at the Assignment at the end of each chapter in the Getting to Know WebGIS book. These general assignments (which we did not complete, instead focusing on the tutorial part of the chapter) give you a good outline for a project that would draw from the techniques learned in the chapter.
The project is worth 75 points, and if you look at the Evaluation page for the course, you will see that this is about three times more points than working through and documenting one of the book chapter tutorials. That should give you a comparative idea of how much work to put into the project. The project should be completed by the end of the semester.
Reading and Presenting Making Maps: we also neglected to spend much time on the readings from the Making Maps book. I’ve now included a Making Maps Marathon for weeks 9, 10, and 11. I’ve split the book into three sections and will have each of you present a chapter. Shoot for a 10-15 minute overview and feel free to use the PDF for the book as part of your presentation.
Week 9: Monday, October 12:
Week 10: Monday, October 19:
Week 11: Monday, October 26:
Week 11 will also mark our return to the Getting to Know WebGIS book, and we will work on chapter 4 for that week, and subsequent weeks will cover chapters 5-8.
End of the Semester: What is due at the end of the semester is your course project and a digital portfolio, consisting of links to all your weekly assignments (so I can review them quickly, and to help you make sure you did them all) as well as a final assessment. The final assessment should not take too long, is “open book” and consists of having you read one short article and reflect on the course.

For week 6 of this bedeviled class, please fling your brains into KW ch. 6, 7, and Read / Complete: PF ch. 3. As uysual, add yhour notes to your blog for the week. I seem to be typing extyra y’s today. Y you ask? I’m outside on my front porch and it’s actually cold and my hands are a bit sluggishy.
I’ll talk thru PF ch. 3 with my insightful comments tomorrow (Mondya, Stp. 21).
On Wednesday: please let us go around the class and share the following (about 10 minutes each)
As always, use the Google Group for questions, and I’m happy to meet (Zoom): just let me know some times that work for you.