 My documentation, below, is not as complete as student documentation should be. I’ve left off notes for readings in the KW book, for example, as I’m the author and have memorized the book.
My documentation is also not on a blog. But it’s easy for you to find here at the course web site.
I will include some notes for the Getting to Know Web GIS book. I will also try to include technical ArcGIS Online details, as I run through the Getting to Know Web GIS book with all y’all.
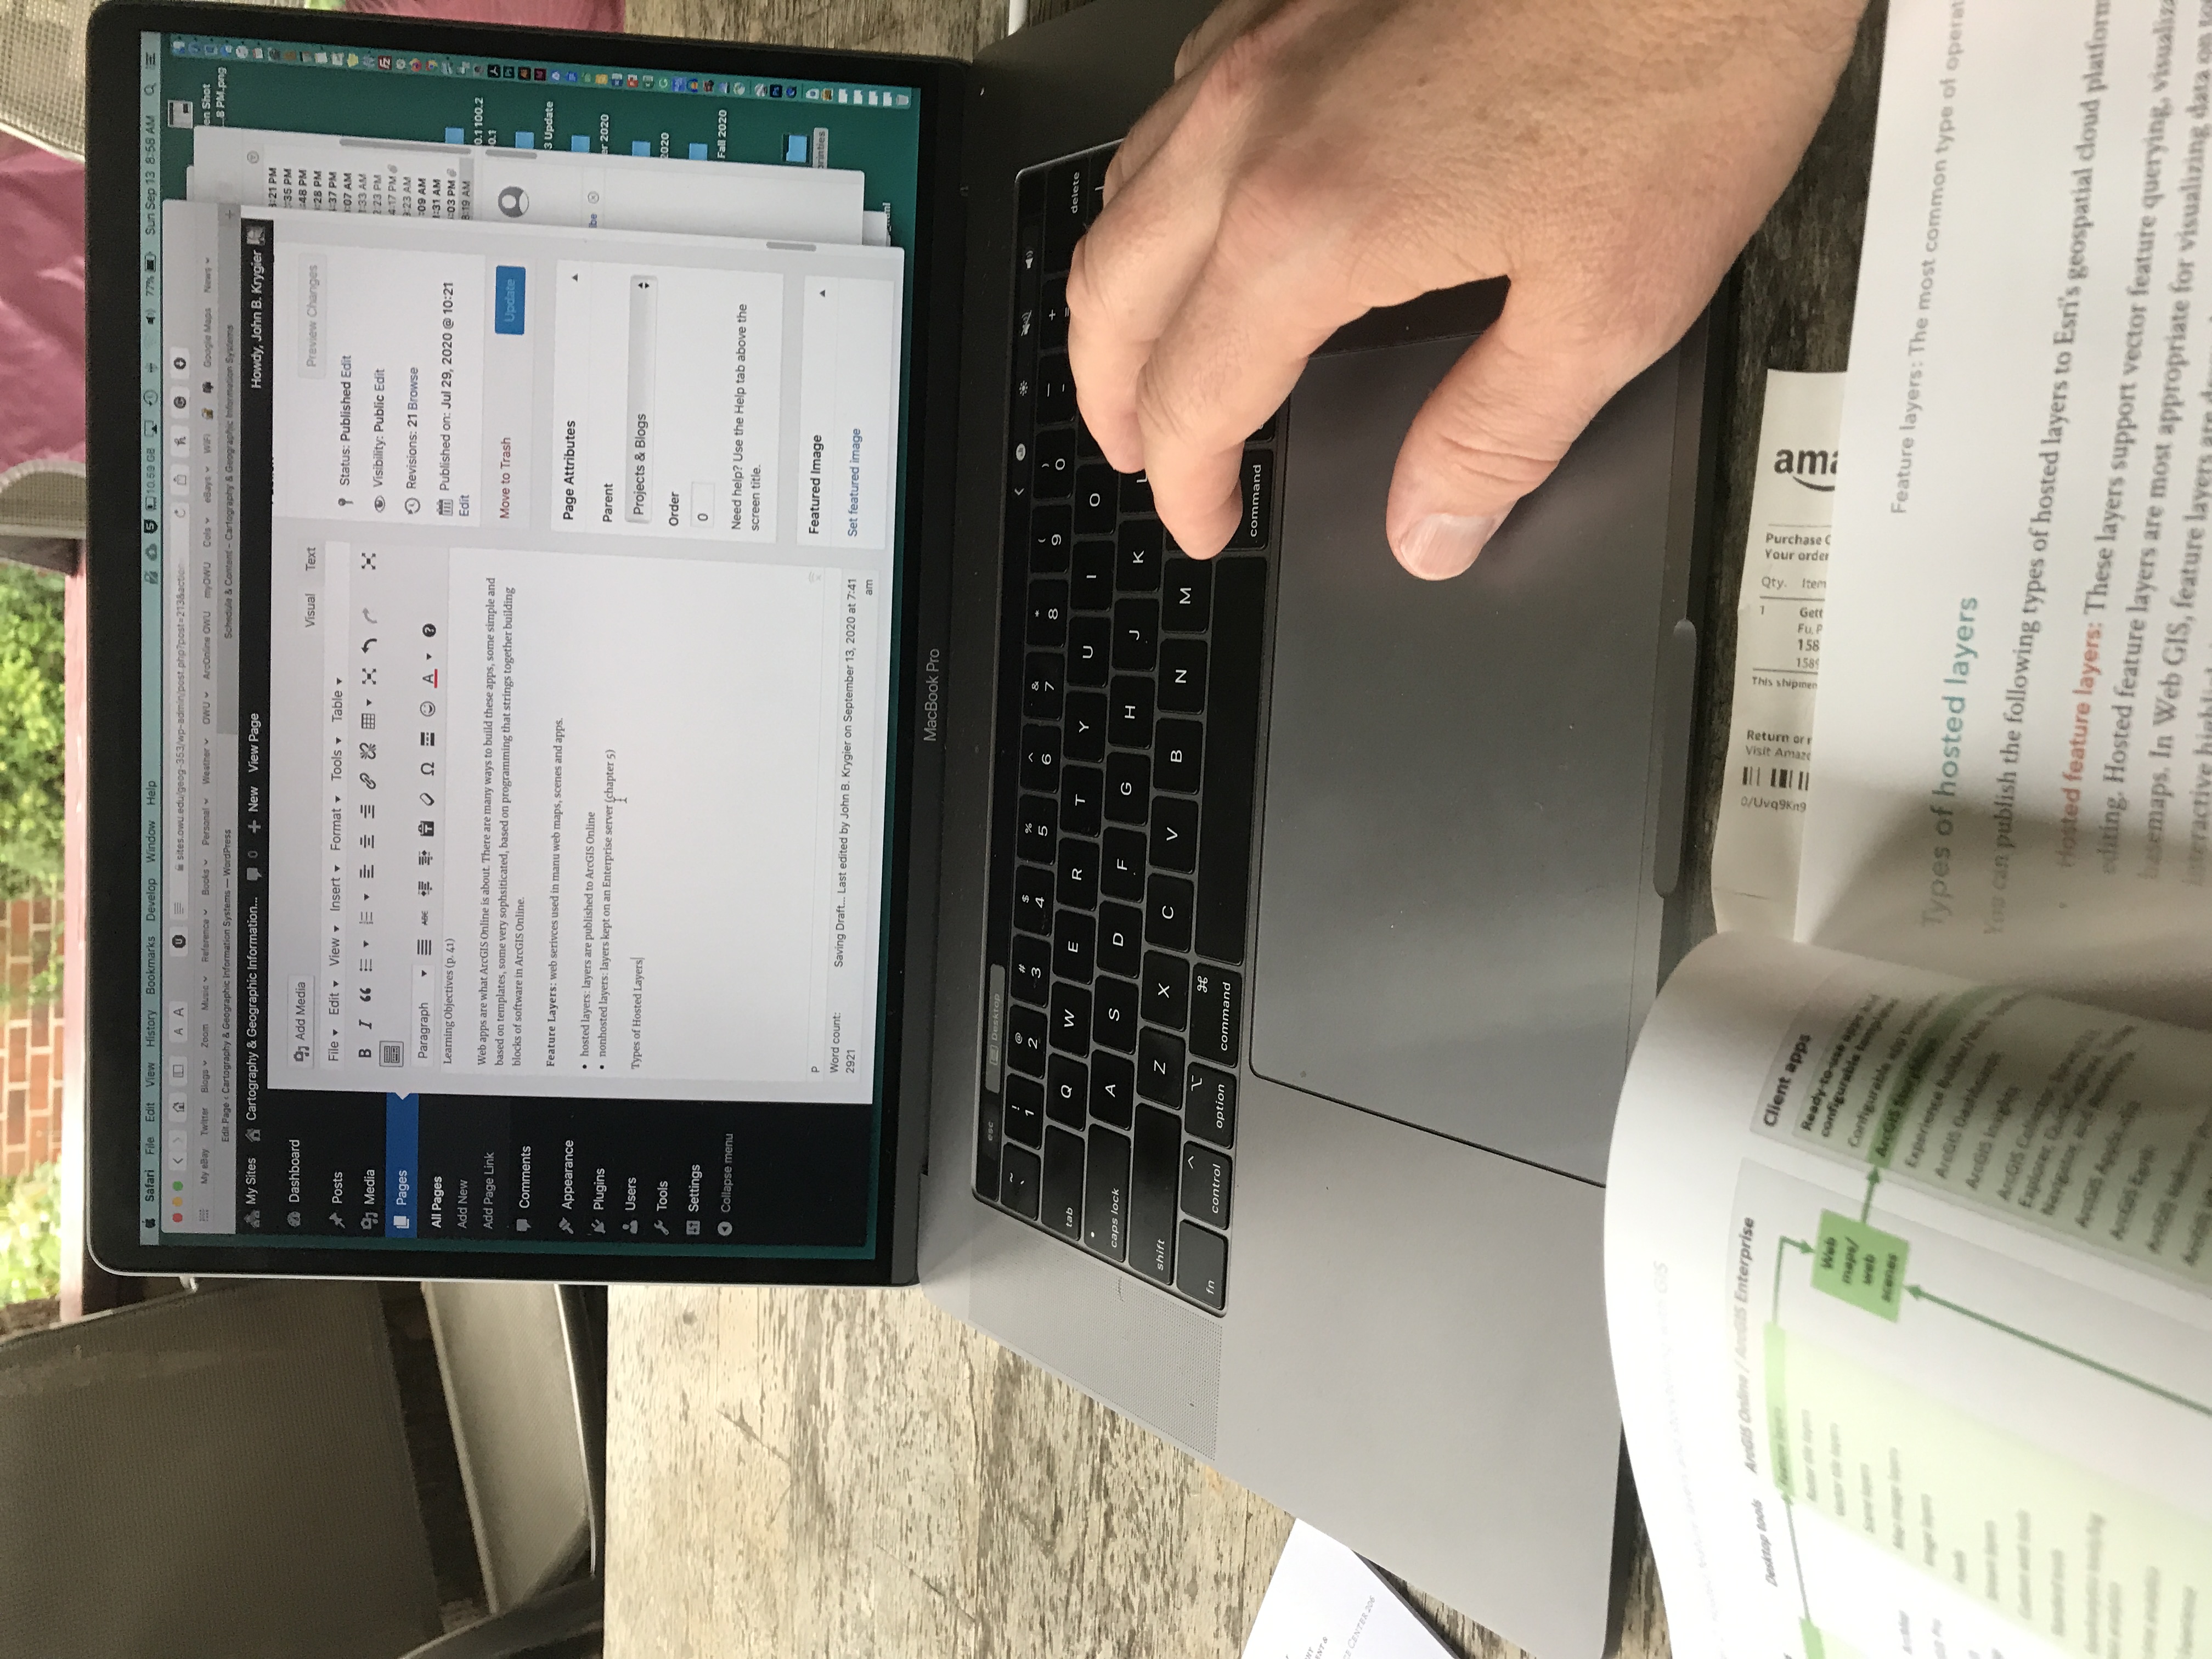
I suggest you take notes as you read and work on the tutorials, as shown in the photo. Typing (like writing) actually registers information in your brain (as opposed to just reading it, or highlighting it). So type it up, add your own comments, questions, and thoughts as you do so.
Week 1: Documentation
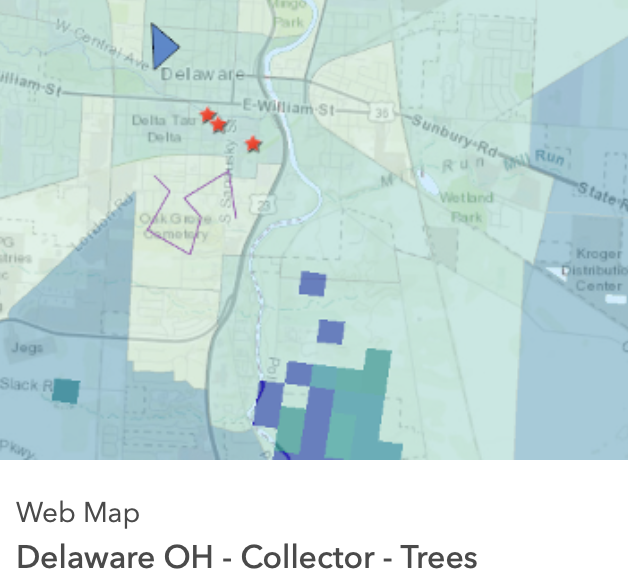
I created a Collector map centered around Delaware and added some points, lines and areas to the map. This effort was to test if we could do one of the projects available this semester, starting to collect tree data with the new City of Delaware arborist. The tutorial (linked to this page) has some quirks, specifically in getting the pop-up window to work correctly when using Collector in the field. This has to be set up in ArcOnline. I sort of figured it out using the Google.
Week 2: Documentation
This was the first actual week of classes for Geog 353. It went smashingly well.
Mostly discussion of the big deep thoughts readings. Getting ArcOnline accounts set up.
Week 3: Documentation
Later in week 2 and in week 3 we got our ArcOnline accounts up and running, linked the MyESRI accounts, and completed the basic tutorials. Linking MyESRI allows OWU account holders access to additional free resources.
Some confusion occurred when students had two accounts (a personal and OWU account) open at the same time. There is a way to join these accounts, to make sure there is no such confusion in the future.
The biggest confusion this week was with saving and ArcOnline. ArcOnline autosaves, but in some instances, ArcOnline indicated that there were “unsaved changes” with no option to save. We are still working on this issue.
Week 4: Documentation
The effort this week is aimed at completing a test run of applied ArcOnline: creating a map that can be accessed and data added on the collector app. This means students must know enough about ArcOnline to get the map created and have the app downloaded and working.
GPS Accuracy: typical phone or tablet GPS accuracy is not great (maybe 30-50 feet off). I ordered a half dozen Garmin GLO 2 smart-device GPS enhancers. These thingies connect via Bluetooth to your phone or tablet and get the accuracy down to maybe under 5 feet. That’s decent. Dustin Braden put together documentation on connecting the Garmin GLO 2 here.
Notes on Readings:
KW ch. 2, 3, 4
- I’m skipping this but you shouldn’t
PF ch. 1: Getting Started with WebGIS
Note the jargon! Define!
- what are “workflows” in relation to WebGIS?
- what is Geospatial? the Geospatial Cloud?
- Learning Objectives: good to use this as a way to guide your notes on readings in this book
- A morass of technology: some of it we use a lot (http, html, url) and other stuff that is a bit more obscure, but central to running software on the internet
- Brief history: GIS in the 1960s, internet in the 1950s, WWW in the 1990s, webGIS in the 1990s (Xerox)
- List of advantages of WebGIS: think about the kind of new applications and audiences that this technology can create and reach: it’s not just about showing what is there, it’s about sharing, learning, collaborating, empowering and changing the world.
GIS is about where: a field with core concepts and approaches (maybe a science) that underpin the technology. GIS is a tool (method, means) of understanding and creating new knowledge.
Web GIS: mapping, visualization, data management, field mobility, monitoring, analytics, design and planning, decision support, constituent engagement, sharing and collaboration (look these up if they don’t make sense)
Access for Billions: as long as you have a decent computer and internet access.
Applications: across just about all fields
Geospatial Cloud powers Web GIS
- ArcGIS Online: “software-as-a-service” (SaaS) offering web-based GIS
- hardware maintained by ESRI and Amazon Web Services
- ArcGIS Enterprise: software that an organization can run on their own servers. For more advanced users and organizations that want their Geospatial Cloud under their own control. Access through Portal for ArcGIS
Privacy and security: compliance with standards, but worthy of note as you build maps and applications on ArcGIS Online
Evolution in Technology and WebGIS
- From closed (isolated?) websites to open geospatial web services
- Web services technology: building blocks that can be shared and remixed (mashups)
- server-side: custom services
- client-side: use and combine services into web map apps
- From one-way to two-way information flow
- early users: received information
- development of user-generated content: UGC, or volunteered geographic information (VGI)
- crowdsourcing, citizen science, etc…
- Portal Technology
- Geoportals: gateways to additional information, web resources, and sites
- create community engagement platform bringing together people, data, tools
- Cloud GIS: delivery of software and content (vs. desktop software)
- access to basic GIS functionality for free
- Mobile: mobile devices becoming the focus
- Map visualization expands to 3D and virtual reality
- Data sources expand to real-time and spatiotemporal big data
- Web GIS becomes more intelligent: analysis, understanding, expanding knowledge
Web GIS Information Model: users, web layers, maps and apps
- users: create and join groups
- content items: data, web layers, tools, web maps, apps, etc.
- content with metadata (information about the data)
- share or keep private
Web GIS Content
- data: csv, txt, shapefiles, GPS/GPX, photos, imagery, etc.
- layers: feature layers, tiled layers, vector layers, map image layers, image layers, CSV layers, etc.
- web maps and scenes: web maps (2D) or scenes (3D), design and access
- tools: analytical functions: geocoding, routing, generating PDFs, hot spots, proximity, etc.
- apps: lightweight map-centric computer programs that can be used via a browser on any device.
Apps: The Face of Web GIS
- Web GIS apps for users to interact with
- available apps: Story Maps, Scene Viewer, Collector, etc.
- capacity to create your own apps.
ArcGIS Online User Types: levels (Geog 353 users set to Creator)
Basic Components of a Web GIS App
- base map layers: reference, background layer: satellite, topographic, streets, etc.
- operational layers: more specific data: census, crime stats, environmental data
- tools: query, geocoding, routing, etc.
Web Layers or Services: Building Blocks of Web GIS
Services are live, accessible, sharable, re-combinable layers, maps, tools, etc.: they can be updated and modified, used by many different users in different ways. The idea of service: “helping or doing work for someone.”
This chapter: feature layers and services
Hosted and Non-Hosted Feature Layers
- Feature layers: vector data: points, lines, polygons
- hosted: stored in ArcGIS Online cloud database
- non-hosted: user-managed data, an organizations own database
Publishing hosted feature layers: Chapters 1, 2, 4, and 5
Web Maps and Web Scenes
Building Web GIS Applications: many options
GeoTagged Images: Exchangeable Image File Format (EXIF) data stored in image: location data stored in images
Attachment Viewer: tool in ArcGIS Online that allows you to store and view geocoded images, etc.
I’m going to take a break and work on the Collector map
My Collector Project: Dr. Downing is interested in having her students use Collector. I have to see if I can make an appropriate map:
- following the Make Your First Collector Map Tutorial (here)
- Instead of naming my point feature “points” I named it Trap (for Dr. Downing’s project)
- Feature layer title: Downing Conservation Trap Data
- It took a minute for the new feature layer to save… so just be patent.
- I provided a description of the layer: “A test map to be used by Dr. Downing’s Conservation course, fall 2020. Insect data caught in traps on and around the OWU Campus.”
- Please give layers and files names that make sense, and keep them organized. Delete stuff that you no longer need.
- In creating fields (the columns in the spreadsheet) I used Dr. Downing’s guidelines
- Trap: trap (display: Trap Number)
- I left out lat/long as that is automatically collected by Collector
- Name of Location (eg., SCSC South West Entrance): LocName (display: Location Name)
- Date of sample (also left off as this is already collected – CreationDate)
- habitat description (urban, forest, impervious, grassland, edge, etc): habitat (display: habitat description)
- You can create a list of options: Dr. Downing gave me some of these (urban, forest, impervious, grassland, edge, etc) but not all of them, so I’ll leave it up to the student to type in the habitat type for now.
- I did add “notes” as specified in the tutorial. To enable attachments (such as a photo) I noticed that my version of ArcOnline has the enable attachments in a slightly different place.
- Add new map is now Create new map
- Title for new map: Insect Trap Data, Fall 2020
- Summary: “Collector map for collecting insect trap data, Fall 2020”
- I continued to follow the tutorial and the Collector map seems to be working
- I opened Collector on my phone, selected the Insect Trap data, Fall 2020 map and added a point. The accuracy of the location is poor (not using the Garmin gee-gaw) but was able to add the location and other data fields (trap number, Location Name, Habitat Description, and a photo).
- I can see that I’ll have to get Dr. Downing to give me a list of habitat descriptions, and maybe location names so the data collection is easier in the field. This will make a cleaner spreadsheet of data.
- Next: can I share this map with Dr. Downing (and her students) so they can access it without having to have an ArcGIS Online account? Google:
- Share a map for data collection in Collector
- So I hit share and selected “Ohio Wesleyan University” – hope this means it will share with Dr. Downing and her students. I’ll email her and provide instructions for downloading Collector and accessing the map. But I’m dubious. Just sent an email to Janelle Valdinger.
- Response to Test: Dr. Downing could not access the map, despite the fact that it was shared with anyone in the Organization (which should be all OWU ArcOnline accounts). So I created a Group (which is a subset of people in the organization) called Downing – Conservation and made her part of that Group, and it worked. Huh.
- Janelle V. suggested I create another account that is just for the students (one account for many students) and use that, rather than 30 individual accounts, for students to add data to the map. The only issue may be if multiple students attempt to edit the table of data at one time. But they should only be collecting data, not puttering with the table.
- Share a map for data collection in Collector
Back to the Tutorial
I’m going to try and do this with my own photos, which are geotagged. I’ve created a folder of them on my desktop. The tutorial refers to a zipped file, so I created one of my photos, but left the unzipped files in the folder also.
I forgot to add both the Image Collection and Feature Layer to the new folder I created (Chapter 1) thus got confused on p. 28)
I used the Topographic base layer, rather than the Open Street Map they suggested.
Page 30, step 1: Map Viewer (Beta): lots of stuff here: slightly updated from book
Error: On p. 33: step 14: the book says “Attributes” but click on “Fields” in the popup pane.
Error: On p. 33, step 14 again, deleting is a bit different.
Done with the simple web map: now create a web app using a template (attachment viewer template)
Error: On p. 34 the configuration of the app details seem to be different from the (beta) configuration details on the actual ArcGIS Online app. I noticed there was a quick setup and full set up options and flipped between both. I finally used the quick setup and just set some stuff and launched. It worked. So don’t panic.
I just skipped the rest of the tutorial.
This is the map of geotagged photos I created: https://arcg.is/0bXSO10
To double-check this is a link accessible to anyone I opened up another browser (FireFox) where I was not logged into ArcGIS Online and it worked there too. Yay.
The “Can’t Save” Problem Solved: this seems to have been a problem with the User Type and Role I assigned to students. It is working now with user type: Creator and Role: Publisher. This is administrative stuff students won’t have to deal with.
Week 5 Documentation
Mop up from Week 4:
Dr. Downing, as noted in my effusive notes for last week, is interested in learning ArcGIS Online and Collector. I set up a web map for her, linked to a feature layer that allows her and her students to document the data (insects) in traps placed around the OWU campus (or wherever the students are living, if they are Zooming into class).
While Amy could access the Collector map, and collect data, I could not figure out how to get Amy to see the web map and feature layer in her ArcOnline account. So I emailed Janelle Valdinger, a recent OWU grad and City of Delaware GIS person (as well as OWU Career Connection). She figured it out. I have no idea what she did.
Problem solved: When you share a web map or feature layer with someone else, it does NOT appear under Content / My Content. It appears under Content / My Groups. Shit. Eat my leg and call me Aileen.
Two points:
- when you are banging your head against the wall about something in ArcOnline – ask someone else for help (or search on the internets)
- often getting really stuck only takes a minor bit of insight to get unstuck. Janelle had no idea what the problem was, but figured it out in about 5 minutes.
Now Dr. Downing and I have to figure out if we give all the students in her class an ArcOnline account, and how to get them up and using the software.
Read: KW ch. 5: on map projections. Don’t skip it, but I am.
Read / Complete: PF ch. 2: Hosted Feature Layers and Storytelling with GIS
Editorial comment: One of my gripes with ESRI is that it seeks to dominate and define the world of mapping and GIS. One consequence is that their books and tutorials tend to suggest that the way ArcGIS or ArcGIS Online has been programmed, and the jargon the sofware uses, is the conceptual content of the broader field of mapping and GIS. This is only sort of true. The ESRI universe is one implementation of much broader concepts and ideas. It does not define those concepts and ideas. Also, I know why they do it, but it is annoying to see terms and concepts (Story Maps) with a trademark symbol after it. Real intellectual concepts are not copyrighted.
I’ll throw in some comments as I read the Fu book that point out some of the broader conceptual issues the book is referring to (as opposed to sticking to ESRI world, alone).
Layers: a fundamental concept in mapping and GIS which plays out in different ways in different software. For vector GIS, layers are typically point or line or area data (you don’t mix these geometric primitives) and one category of data from the real world. So:
- a point layer of well locations
- a line layer of rivers and streams in a county
- an area (polygon) layer of property parcels in a county
A feature is something at a point, along a line, or in an area.
Vector GIS is based on a world reduced to points, lines, areas, and volumes.
An alternative is Raster GIS, which is based on a grid (with cells of varying resolution). Typically used with imagery (satellite, drone, etc.)
This chapter is going to cover ESRI’s idea of layers, which are the key components of ESRI web apps. One kind of ESRI web map is a Story Map.
Learning Objectives (p. 41)
Web apps are what ArcGIS Online is about. There are many ways to build these apps, some simple and based on templates, some very sophisticated, based on programming that strings together building blocks of software in ArcGIS Online.
Feature Layers: web services used in many web maps, scenes, and apps.
- hosted layers: layers are published to ArcGIS Online
- nonhosted layers: layers kept on an Enterprise server (chapter 5)
Types of Hosted Layers
Hosted feature layers: most appropriate for visualizing data on top of your base map, can be interactive, can be read-only or users can add and change data.
Note: many of these layer types mention that the data is processed in some way to make loading and viewing quicker (caches, tiles, etc.). This is so the maps load quickly on the web or on a phone.
Note: some of these layer types mention open-source formatting that allows the data to be used in open-source software, thus not requiring proprietary software to use.
- Hosted feature layers: the most common: read-only or editable.
- Hosted web feature service (WFS) layers: read-only, with Open Geospatial Consortium (OGC) compliant formatting.
- Hosted tile layers: fast viewing, using tiles of data (draws big files quickly)
- Hosted vector tile layers: 2D and 3D content, adaptable to different resolution devices
- Hosted web map tile service (WMTS) layers: OCG WMTS standard layers
- Hosted scene layers: 3D maps with cached tiles for fast drawing
- Hosted image layers: raster data (satellite imagery)
- Hosted map image layers: Enterprise.
Publish Hosted Feature Layers
Smart mapping, pop-ups, and ArcGIS Arcade
Smart mapping: a series of default settings that allow users to create professional-quality maps with minimal mapping knowledge or software skills.
Note: this is nice, but also tends to make all maps look exactly the same, even though they are claiming that “smart” defaults mix it up. Ok, so all the maps look like a half dozen similar styles.
Pop-ups
- Configurable data windows that pop up when a user clicks on the map: text, images, data, links, etc.
ArcGIS Arcade
- A scripting language for extracting knowledge from existing data layers. Sort of like formulas in Excel
ArcGIS Living Atlas of the World
- A library of data you can use, both base map and overlying information layers
- Includes base maps, imagery, boundaries, people (demographic data), and environmental data
- Some of the data is updated on a regular basis – minutes, hours, days, weeks, etc.
Storytelling using Web GIS and principles of user experience design
FEF: Fast, easy, fun user experience design
- Fast: yeah, people hate waiting: thus the emphasis on methods to deliver and render maps quickly online.
- Easy: a traditional component of map design: like effective grammar in an essay.
- Fun: integrate photos, charts, videos, animation: Fun is a bit of cheese here: the reason you should integrate all these different visual forms is to help users get the data and knowledge you are including in your web map. You are not just doing this for fun. There is also a danger, here, of including lots of map crap (flashing stuff, colorful fluff) that does not really deliver any information. You can deliver information effectively and, as a byproduct, make your web map fun. But fun shouldn’t be the first goal. I hate fun.
Note: map making (cartography) has long examined how users interact with maps and the data on maps. The idea is to make sure that the “message” you want the map to communicate is communicated by the design of the map. Poor map design, from this perspective, is like poor grammar: the reader (or map reader) will have difficulty making sense out of what you are trying to communicate. ESRI’s fast, easy, fun is an expansion of this idea into the realm of online, popular map media.
ArcGIS Story Maps: Storytelling using Web GIS
StoryMaps is a component of ArcGIS Online that allows you to create web presentations that have a narrative structure that a user follows from beginning to end. An array of maps, images, videos, etc. can be strung together to tell a story. The interface here is similar to the block editing incorporated in WordPress and Squarespace and related software.
- Story: who, what (theme), when (time), where (location), why
- GIS is good at all of these, and thus a good tool for generating stories (with maps at their basis)
- StoryMaps (one of those copyrighted terms):
- blocks: components to build a story with
- immersive blocks: break from the standard vertical scroll
- block palette menu of interactive components
- Express Maps: add geographic context
Tutorial 2
Getting to Know Web GIS (4th edition): Download resources for the tutorials here.
2.1 Create a Feature Layer from a CSV file
Geocoding: when you upload the population .csv file (also viewable in Excel or similar software) you don’t have latitude/longitude coordinates. But you do have city names. Geocoding is a tool that takes any kind of locational indicator (city name, street address, county name) and gives it coordinates so it can be mapped out.
2.2 Configure Layer Style
Attribute: a category (or column) of data in a mappable spreadsheet (or table). For example: for Delaware County, attributes could be
- Census 2000 total population
- Census 2010 total population (etc.)
Mapping Ratios: you are creating a map using the ratio of the population from 2016 to 2010, and thus population growth. Cities with larger circles have greater growth than cities with smaller growth. This is a good example of how we can create new data (ratios) from existing data (counts).
Data Classification: we will see how data classification works in KW ch. 8. In essence, it is putting data into groups to make it easier to interpret.
The description of the Arcade scripting (p. 62-63) is a bit obscure, but the point is that you are building a little formula that will generate some unique data for your map. If all else fails, just type in the expression shown on the top of page 63.
2.3: Configure Layer PopUps using Arcade
- The pop-up window editing leads to a simpler set of data in the pop-up.
2.4: Adding images and Wikipedia links to a popup
- notice that there is a significant amount of work required to add the links to the .csv file
2.5 Use Layers from ArcGIS Living Atlas of the World
p. 67: by “new Map Viewer” they mean the Map Viewer Beta
Note: there are a few vague instructions in this section but you should be able to figure them out.
2.6: Create a Story Map
error: p. 69: step 5: not “create” but “new story” then “start from scratch”
error: p. 69: not “Add image” but “add cover image or video”, but the file they specify can’t be found so just use a picture from your computer. This is mine. Also with a custom title and subtitle. You don’t have to CONFORM TO THE DEMANTS OF THE MAN.

Week 6: Documentation
Read: KW ch. 6, 7
I skipped, but you shouldn’t
Read / Complete: PF ch. 3
Preface: This chapter is the worst yet. The tutorial section on Experience Builder is terrible. Not only has the software changed, but the tutorial is poorly written, with confusing and too brief explanations. I found out that the save option is under the menu consisting of the three vertical dots. That’s just stupid, in the first place (bad software design) but it’s ridiculous that that is not mentioned in the tutorial. Despite this, stick with it. Do your best, don’t get too frustrated. Don’t give up, but go back and re-read the instructions and look at the online software. Try some different options if you can’t figure out the instructions. Nothing bad will happen (except you can delete the tutorial and start over).
ArcGIS Web App Builder > now ArcGIS Experience Builder: more functionality than any other ArcGIS configurable web app or template, and are more flexible and configurable
Widgets: components that do specific things (mapping, table view, querying, charting, etc.)
Select and use these widgets to create an app, without having to program
Now: Experience Builder does not have all the widgets of App Builder but will get there…
Learning Objectives
- know when you need AppBuilder/Experience Builder
- understand differences between AppBuilder/Experience Builder
- types of widgets and themes of the app builders
- workflow for creating apps
- configure widgets
Basics of Web AppBuilder & Experience Builder
WYSIWYG app builders to create 2D and 3D web apps with no code
Use ArcGIS Online, Enterprise, HTML5, ArcGIS API for JavaScript
Features
- pure HTML JavaScript apps that are cross-platform
- responsive apps: work on desktop, tablet, phone
- collection of widgets that can be combined
- themes and templates
- capacity to program new widgets, themes, templates
Experience Builder: catching up on widgets, but these improvements:
- flexible layouts
- mobile-first design (AppBuilder is only mobile-friendly)
- can combine 2D and 3D content (AppBuilder can have either, but not both)
- has action triggers (user zoom in 2D map leads to automatic zoom in 3D map)
Using the Builders to Create Web Apps
- pick a template or start from scratch
- add content: web maps (2D) or scenes (3D)
- add widgets: maps, images, text, lists
- configure widgets: layers and fields associated with each widget
- preview, publish, share
Widgets
- most have a visual interface
- data independent widgets: basemap gallery, measurement, draw; usually don’t need configuration
- data dependent widgets: query, chart; linked to specific fields or layers (data) in your app
- additional apps are added by user communities
Themes and Templates
- look and feel: panels, styles, layouts, themes
Editions of Web AppBuilder and Experience Builder
- Embedded in ArcGIS Online, Portal for ArcGIS, Developer Edition
Developer Editions
- Download: for more serious app creation
Tutorial 3
- using both Web AppBuilder and Experience Builder
3.1: Create a web app using Web AppBuilder
Error: find the web map: not under the name in the book: but close: Historic Earthquakes and Hurricanes
Web MapWeb Map, by Learn ArcGIS (Authoritative)
Clarification: step 10 (p. 92): By the “preview pane” they mean the map, on the right, I guess in preview mode
Clarification: step 27 (p. 96): I had to add the legend widget to the empty widget holders, bottom of widget tab
3.2 Configure chart-type widgets
Clarification: step 1 (p. 96): this is the area at the top of the widgets tab, “set the widgets in this controller” – click on this area to add a new widget >> click on the + symbol
3.3 Configure filter-type widgets
- adding filter and query widgets
3.4 Use Experience Builder to create a web app
This is the kind of thing Experience Builder is trying to replicate:
Error: step 6, p. 109: I clicked on web map (left) and ArcGIS (top) and then typed “fun park” IN QUOTES to find the data (which is down the list of results).
Error: step 11, p. 111: under Content tab, click on select map (not set data)
Error: step 13, p. 112: under Content tab, click on select map (not set data)
Error: step 16: to save, click on the 9 dot grid, upper right, then select the floppy disk icon (shit heads)
Error: step 20, p. 114: double click on widget text, and select the cylinder with lines icon
Error: step 21, p. 114: double click on widget text, change to SIZE. Then select the cylinder with lines icon. Click once on ObjectSize, then click on Expression tab. Type feet next to the expression in the top box.
3.5 Configure Actions and Menus
Error: step 22: share is under the three horizontal dot menu, upper right
Well, for better or worse: the Experience Builder tutorial app I made
There are lots of minor changes to Experience Builder that make this section of the tutorial frustrating. You really have to putter around to figure out the changed options. I did not get the List Widget configured correctly, as you can see. Mleh.
I believe that it is probably best to stick to the older, ArcGIS Web AppBuilder, rather than the newer (and evolving) Experience Builder.
Week 11: Documentation
Read / Complete: PF ch. 4
Advantages of Mobile over Desktop GIS
- mobility (duh)
- location awareness: location, direction, tilt angle, moving speed
- data collection:
- near-real-time information: monitoring
- larger user group: everyone has a phone, tablet, etc.
- versatile communications:
Basic Technologies involved: costly, small, sophisticated devices but many people (regardless of income or other challenges, have one).
- Mobile devices: smartphones, tablets, smartwatches, etc.
- Mobile operating systems: Android, macOS, Microsoft
- Wireless communication technology: Bluetooth, Wi-fi, cellular networks, satellite service
- Positioning technology: GPS, cell network triangulation, wi-fi triangulation, indoor positioning service (IPS)
Feature layer edit settings, views, and feature templates
There is a difference between read-only hosted feature layers published to the web, and layers that support editing, adding, removing data, etc.
- ArcGIS Pro supports more advanced editing
Owner of hosted feature layer can allow users to
- add, update, delete features
- add and update features
- add features (add a damaged sign report, but not remove previously reported data)
- update features
- update attributes (update status of insect trap at a particular location)
- enable attachments (photos, sound files, videos with locations)
- enable editor tracking (who is making what changes)
Feature Layer Views
Create a view layer from your hosted feature layer: this allows, for example, a feature layer that is available to field-workers to update the data, and public viewers to immediately see the updated layer, but not change it.
Feature Template
- Feature templates determine the types of data items can add to a layer
- Data integrity: limit the kind of feature to be added, to, for example, elementary, middle, and high schools on a school hosted layer. This limits the kind of attributes a user can add
- Ease of editing: preset symbols and default values to clarify the kind of data being added, limit amount of typing in the field
Mobile App Development Strategies
- Browser-based approach: apps built using HTML, JavaScript, and Cascading Style Sheets (CSS). Access via browsers on any device. Advantage of reaching all mobile platforms. Typically cheaper to develop than native apps. Limited to the features of the web browser and often limited in the GIS capabilities that can be performed
- Native-based approach: Apps you download and install on your device are native apps. More development skills required. Objective-C or Swift for iOS., Java for Android, .NET for Windows Phone. Deep access to device hardware and typically better performance. More expensive to develop and one native app won’t run on different platforms (have to program for each
- Hybrid-based approach: ArcGIS supports API (application programming interfaces) that enable hybrid app development.
ArcGIS native apps for field and indoor applications
Native apps provided by ArcGIS for field operations: ArcGIS Collector, ArcGIS Collector123, ArcGIS Workforce, ArcGIS Quick Capture, ArcGIS Tracker, ArcGIS Navigator, and ArcGIS Explorer.
- ArcGIS Workforce: plan and coordinate fieldwork: asset management software (project owner, dispatcher, mobile workers)
- ArcGIS Navigator: routing with special maps and rules (an independent Google Maps)
- ArcGIS Explorer: display web maps, search for places and features, navigation. Off-line mode with the capacity to download data to allow you to work while offline.
- ArcGIS Collector: collect and update data, download maps and work offline, collect points, lines, areas, data tables, fill out map-driven forms, attach photos to features, connect to professional-grade GPS receivers, search for places and features, support 3D data collection
- ArcGIS Survey123: Design smart surveys with predefined questions, with rules; field data collection, store survey results in hosted feature layers, on and offline capabilities
- Survey123 Web Designer: WYSIWYG environment to build simple surveys
- Survey123 Connect: more advanced surveys, uses XLS file format (Microsoft),
- ArcGIS QuickCapture: Rapid data collection from moving truck, helicopter, off-road vehicle. Capture locations, attributes, photos by touching one of the big, simple buttons. Guess where this came from?
- ArcGIS Tracker: capture the locations of mobile users, monitor where they are and have been. Contact tracing, but mostly used to keep track of employees. Runs in the background and collects location data. Surveillance.
- ArcGIS Indoors mobile app: wayfinding, calendar (meeting locations), search for specific people, incident reporting, location sharing, and tracking
- ArcGIS Companion: manage content and administer your WebGIS
- ArcGIS AppStudio: create custom mobile apps across platforms. Helps create apps that can be distributed via iOS, Android, etc. stores
VR, AR, and Other Popular Apps and Frontiers
LBS: Location-based services. Services that know where you are, and push information to you based on your location. POI = point of information.
VGI: volunteered geographic information. Part of the broader field of user-generated content. An outgrowth of participatory GIS and collaborative mapping efforts. Similar to crowdsourcing, but with a geographical component.
VR: computer-generated 3D simulation. Typically require VR glasses. Immersive experience. More detail in chapter 7.
AR: Augmented reality: overlays enhanced (additional) information and appends through a live view device. Go downtown Delaware, hold up your iPad and see downtown (currently) but have historical photos appear when available, showing you how your view looked at different times in the past. ESRI AuGeo: mobile app for creating AR experiences.
Tutorial 4: I can hardly wait!
4.1. Design a Survey for ArcGIS Survey123
- Go to https://survey123.arcgis.com/surveys
- New Survey
- Step 7: error: “imagery hybrid” is not an option.
…ok, I rather rushed to get through this section and did not take detailed notes. I did not notice nearly as many errors in the tutorial sections.
Week 6: Documentation
Read / Complete: PF ch. 6: Spatiotemporal & Real-Time GIS
Editorial commenst:
Good stuff about this chapter:
- a technological/software basis of visualizing geographic data with a time component
- a technological/software basis of visualizing real-time data
Meh Stuff about this Chapter
- completely unaware of a significant amount of research on visualizing spatiotemporal data
- as such, only superficial and obvious ways to visualize this kind of data
- the book is deceptive: a software manual disguised as a more comprehensive approach to web GIS
- “concepts” and guidelines are driven by software capabilities (this is the wrong way around)
- readers will be limited in their understanding of visualizing spatiotemporal data given the lack of integration of scholarly literature, the dependence on one kind of software, and the lack of clarity that this is a software manual and not a textbook.
The Chapter: Massive increase in real-time data being generated by phones and other connected devices and the internet of things (IoT)
Spatio-temporal data, IoT, and real-time-GIS
- things that are moving: live feeds of airplanes, buses, cars, trains, ships, fishing boats, stuff in space, etc.
- events that are discrete: criminal incidents, service requests, earthquakes, geotagged social media (f-bombs), unregistered user Wikipedia edits, UFO sitings
- things that are stationary: wind speed/direction, stream gauge levels, traffic speed, air quality, live surveillance feeds, lightning strikes
- things that change: wildfires, flooded areas, urban sprawl, environmental change
Each event has a time value
- point in time: specific time that lightning strikes: store in single attribute field
- duration in time: beginning and end of wildfire: store in two attribute fields (start, end)
Terms
- time measurement systems (units): years, months, days, hours, minutes seconds
- time reference systems (time zones, daylight savings): Greenwich Mean Time (GMT) and Coordinated Universal Time (UTC; does not account for daylight savings time)
- time representations: November 16, 2020; 11/16/2020; etc (International Standard ISO 8601)
- temporal resolution: interval at which events are sampled; automatic vehicle location (AVL) system checks the location of vehicle every 15 seconds; weather station checks the temperature every 15 minutes.
Internet of Things (IoT)
- sources include manually entered data to data collected automatically
- increase in volunteered geographic information (and non-volunteered geographic information)
- Thingful (search IoT)
IoT: network of things embedded with sensors and network connections that allow the objects to collect and share data.
- airplanes, cars, lights, refrigerators, sprinklers, heart-monitors, security cameras…
Information Systems and IoT
- enterprise IoT applications: smart cities, infrastructure management, environmental monitoring, retail inventory management, precise agriculture
- consumer IoT applications: connected cars, health devices, smart homes
- connected devices and sensors to help manage cities
- collect data, analyze data, visualize data to assist decision making
- ex) Amazon Echo, zone thermostats, automatic lights, etc.
- ex) Roomba mapping
Geofence: virtual perimeter for a real-world geographic area, dynamic or static
- ex) retail
- ex) applications (2020)
- ex) Geofence Warrants
Cloud, server, and client-side technologies for real-time GIS
- challenges are the volume of data and its velocity
- specific ESRI products: ArcGIS Analytics for IoT, GeoEvent Server for real-time GIS
Basic capabilities of ArcGIS Analytics for IoT and GeoEvent Server
- Ingest: component of software that interacts with data sources, understands and translates data formats
- Process: filtering and analysis
- filtering: removes events that do not satisfy specified criteria
- attribute filters: exclude airplanes under 100 meters in altitude
- spatial filters: exclusion of car location and speed data when off of specified major roads, based on geofence
- filtering: removes events that do not satisfy specified criteria
- Outputs: saving data, sending to clients, alerts, commands to perform automated tasks
ArcGIS Analytics for IoT
- Feed items: allows users to receive sensor inputs
- Real-time analytic items: data transformation, geofencing, incident detection
- Big data analytic items: summarizing, pattern analysis, incident detection
Deliver real-time data from servers to clients
- poll: traditional approach; client “polls” server to retrieve the latest data at a set interval: refresh map between 6 seconds and one day.
- push: pushes data to web client based on criteria, say after a certain amount of data is accumulated, or when something changes
ArcGIS Dashboards
- IoT Dashboards
- similar to a car dashboard: 911 dashboard, air-quality dashboard, soical media dashboard, COVID dashboard
Animate time-series data
Animation is used to visualize data that has a time-change
- discrete event animations: accidents, crime
- value change at stationary object: air quality, stream level
- map progression: fire, flood, land use
- replay events: emergency response
To animate time-series data in ArcGIS, you create a time-enabled layer with either ArcGIS Desktop or ArcGIS Online, add the layer to a web map, and create a web app using an ArcGIS ready-to-use web client.
- time-enabled layers: each feature must have a single date attribute field or two date fields (start & finish)
- add time-enabled layer to a web map: settings (speed, start time, intervals, cumulative events)
- create a web-app from web map: user control of data