Chapter 7: Digitizing
- Edited the Carnegie Mellon campus buildings by moving, rotating, adding vertices and splitting polygons so they lined up with the World Imagery basemap
- Made a new ParkingLots feature class and drew a parking lot polygon by tracing over the imagery
- The chapter also covered smoothing polygons and lining up CAD drawings with the real map
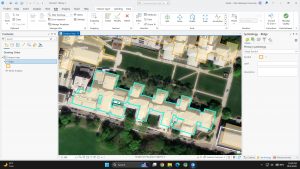
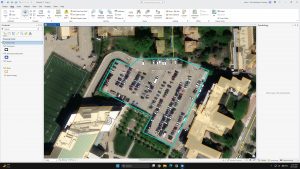
Question: When you trace over a basemap, how accurate is it compared to GPS or LiDAR? Which would you trust for an official map?
Chapter 8: Geocoding
- Geocoding; turning addresses or ZIP codes from a table into points on a map
- Built a ZIP code locator and geocoded survey data from a Pittsburgh arts event. People came from PA, OH, MD and WV, but most were clustered around Pittsburgh
- Used Collect Events to combine attendees in the same ZIP into one point, so bigger circles equals more people (up to 118 in one ZIP)
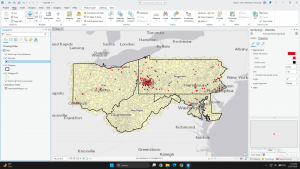
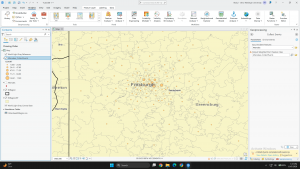
Question: How accurate is ZIP code geocoding compared to street addresses, and when is ZIP level good enough?
Chapter 9: Spatial Analysis
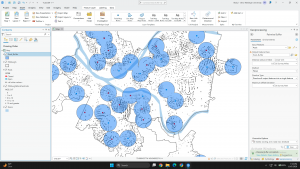
- 9-1: used Pairwise Buffer to draw half-mile zones around Pittsburgh’s 32 public pools, then Select by Location to count kids (ages 5–17) close by. About 44.6% of kids live within a half mile of a pool
- I got ERROR 000210 the first time because the output wasn’t saving to a geodatabase. Picking a proper output location fixed it
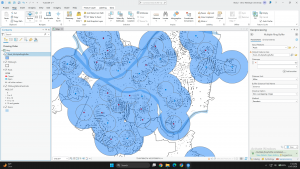
- 9-2: Multiple Ring Buffer with 0.5 and 1 mile rings, so you can see who’s close vs. a bit further
- Buffers are straight-line distance, which isn’t perfect for Pittsburgh with all the rivers and hills. That’s why the chapter moves to service areas on streets next
Question: How much do service areas (real street distance) change the answer compared to simple buffers in a city like Pittsburgh?