Delaware County GIS Data Inventory
I went through the Delaware County GIS Data Hub and read about each layer. Here is what each one is.
- Parcel: Every property in the county as a shape. The table has the owner, acres, value, year built and a land use code.
- Address Point: A point for every address. Mostly used for 911.
- Street Centerline: A line down the middle of every road.
- Building Outline 2021, 2023, 2024: The outline of every building from aerial photos. You can compare years to see new buildings.
- Two Foot Contours: Lines that show elevation every 2 feet.
- Hydrology: The main rivers, streams and lakes like Alum Creek and Hoover.
- Zip Code: ZIP code areas.
- Township: Township borders today.
- Original Township: Township borders from when the county was first surveyed.
- Municipality: City and village borders like Delaware, Powell and Sunbury.
- MSAG: Areas 911 uses to know who should respond to an address.
- School District: School district borders.
- Tax District: Areas that pay the same tax rate.
- Precincts: Voting areas.
- Subdivision: Neighborhoods with their name, number of lots and the date they were made.
- Condo: Condo buildings and complexes.
- Annexation: Land that became part of a city or village over time, with dates.
- PLSS: The old land survey grid used to split up land.
- Farm Lot: Farm lot lines inside that survey grid.
- Map Sheet: The grid for the county’s tax map pages.
- Recorded Document: Land records filed with the county, like surveys and annexations.
- Dedicated ROW: Public right of way lines along roads.
- Survey: Points where land surveys were done.
- GPS: GPS markers set in 1991 and 1997.
- Railroads: Train tracks in the county.
- E911 Data: The full set of data 911 uses.
- DXF files: CAD versions of the addresses, streets and buildings.
I choose to Map: Parcels, Streets and Hydrology
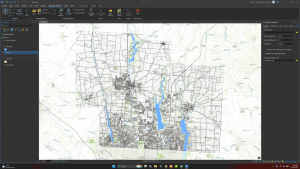
- I downloaded Parcel, Street Centerline and Hydrology as shapefiles and added them to a new ArcGIS Pro project.
- There are 103,042 parcels. The south near Columbus is packed with small lots, and the north is mostly big farm parcels.
- Alum Creek and Hoover reservoirs really stand out, and a lot of roads and neighborhoods are built around them.
Question: Some layers come as both shapefiles and DXF files. Who uses the DXF versions? Is it mostly engineers and surveyors?