Chapter 1:
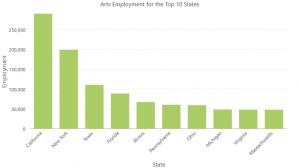
In chapter 1 many of the fundamental topics of operating GIS were discussed. It was a bit difficult for me to orient myself in the program at first with all of the different tabs and panels. This chapter covered selecting content in the beginning. Selecting content is important when you want information about a subset of your data. Attribute tables and summary statistics were also covered. Attribute tables show you all of the different columns of data available. You can calculate summary statistics about the data to see patterns. This chapter discussed display factors as well, like choosing and editing symbols using symbology and making a layer with legends. At the end of the chapter, we worked with a 3D map. I thought that seeing the 3D map was really interesting.
Chapter 2:
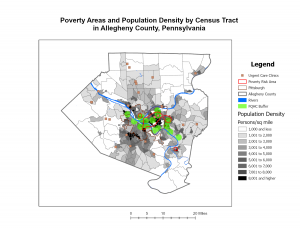
In chapter 2, we designed thematic maps. Thematic maps aim to solve or investigate a problem. We worked with symbology a bit more by color layers, like water and neighborhoods, and using unique value symbols. Making labels that pop-up at different levels of zoom were also covered. This chapter also covered using definition queries to show only a subset of features. Graduated colors and symbols were also used in this chapter. The shades of colors and size of symbols change with associated numeric values. I have found getting to design symbols quite enjoyable. In this chapter we also learned about making dot density maps and choosing the most effective dot sizes and values.
Chapter 3:
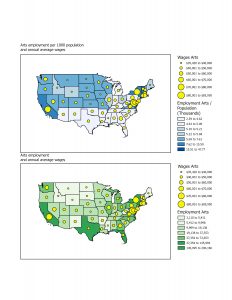
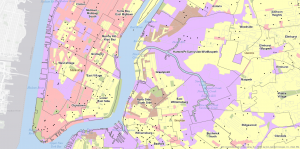
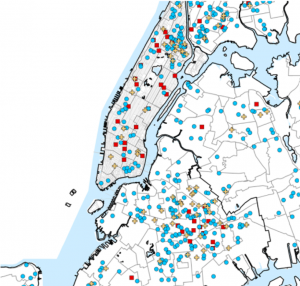
In chapter 3, we learned how to make layouts and some aspects of using ArcGIS online. We had to make a layout for the two arts employment maps along with their legends. Then, we had to post the map on ArcGIS Online. Along with the map we had to make and post a storymap file (https://storymaps.arcgis.com/stories/8e25962b5e634839a015c069b772c460) and a storymap briefing. It was kind of fun making the story file. It wasn’t an aspect of GIS I was expecting, so it was really interesting.