I have finished the GEOG 291 quiz 😀

Pictured above: me standing atop Marblehead Lighthouse 🙂
Prior to attending OWU, I had not heard of anything beyond surface-level mentions of GIS technology or of classes dedicated to GIS, even within my high school’s environmental science course. My brother, previously a field biology major, was not fond of the geology or geography sides of his major, so I initially had a negative impression of GIS and similar courses. Before completing this reading, I had a very rudimentary understanding of what exactly GIS is and what it can accomplish, especially in interdisciplinary studies of the environment such as environmental architecture or environmental impacts on disease research.
Learning of the history of GIS technology and doing my own research into the quantitative revolution that Schuurman repeatedly describes was incredibly fascinating, especially as I could relate it to my own understanding of technology at the time of the 1950s and 60s (specifically think of NASA’s room-sized IBM computers used during the Apollo missions). Additionally, learning of the unclear history of the preceding technologies that ultimately inspired research and the development of GIS technology was both interesting and largely surprising, as GIS technology has been developed in the modern, recorded era and alongside other technological revolutions, such as personal computers and data storage.
Additionally, I was surprised by the pervasiveness of GIS technology in geographical analysis, especially as Schuurman specifically notes how GIS affects construction, transportation, and recreation to such a high degree. Even as GIS has its limitations with fuzzy boundaries that are difficult to categorize, GIS is still an incredibly important technology into understanding multiple environmental and human-dependent impacts and how these factors interact with one another. I was very intrigued to learn about GIS scientists and their ability to predict certain subjects such as urban growth, with the inclusion of pre-existing GIS data and analysis of the rate of growth or decline in certain factors.
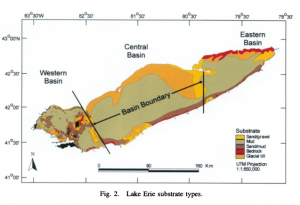
GIS technology can be used to map and understand soil composition and how it may effect an ecosystem. Pictured above is a map of the type of substrate along the bottom of Lake Erie throughout multiple state and international boundaries. Researchers at the Ohio State University analyzed the potential spread of invasive zebra mussels in Lake Erie by modeling the bathymetry and substrate type along the bottom of Lake Erie, using data from both models to predict how the mussels may spread over time.
Haltuch, Melissa A., et al. “Geographic Information System (GIS) Analysis of Ecosystem Invasion: Exotic Mussels in Lake Erie.” https://www.jstor.org/stable/2670637
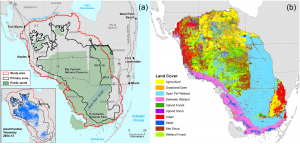
Frakes RA, Belden RC, Wood BE, James FE (2015) Landscape Analysis of Adult Florida Panther Habitat. PLOS ONE 10(7): e0133044. https://doi.org/10.1371/journal.pone.0133044