
I have completed the GEOG 291 Quiz for Week 1
Hello! My name is Payton Beard, and I am a junior from Cincinnati, Ohio. I am a zoology major with a chemistry and ENVS minor, in hopes to either work at a zoo or become a vet. I chose to take this class, as it seemed like something interesting that also followed along with my ENVS minor. Outside of class I am a part of the soccer and softball team, so I am always busy.
3)
After reading this article, I learned how important GIS actually is. I had never heard of GIS until coming to OWU, but it is cool to see all of the different companies, and all of the researchers that use GIS in their everyday lives. GIS can be helpful to so many fields due to the fact that it was developed by multiple fields throughout history. When I first started to search about GIS it really just seemed to me like a bunch of maps that showed random stuff, but after reading this it became apparent to me that it is more than just a map it can show things like transportation or agriculture or even healthcare which is something I would of never expected.
Something I found really interesting in the article is that GIS can be used in decision making all throughout society. GIS can be helpful for planning out cities, where road ways may go (like seen in the beginning of the article), and just how to improve societal ways in general. GIS can really strength society and help display more improvements that could make out world better than it already is. I believe that GIS is a very important part in our world today as it is like a piece of scratch paper where you can continuously make plans until you find the perfect resolution.
Another part of the article I thought was very interesting was how Dr. John Snow was able to use GIS in a way to track the spread of Cholera in London. When I think of a map I think of something that shows landmarks, mountains, or just things like land plots and stuff like that. I would of never thought that you could track the spread of Cholera. Seeing how he was able to track the deaths and the water pumps that the public were using was a major part in him figuring out what was happening and what the relationship the 2 things had. It also helps show that local knowledge mixed with interpretation can be really helpful in figuring out big problems.
4)
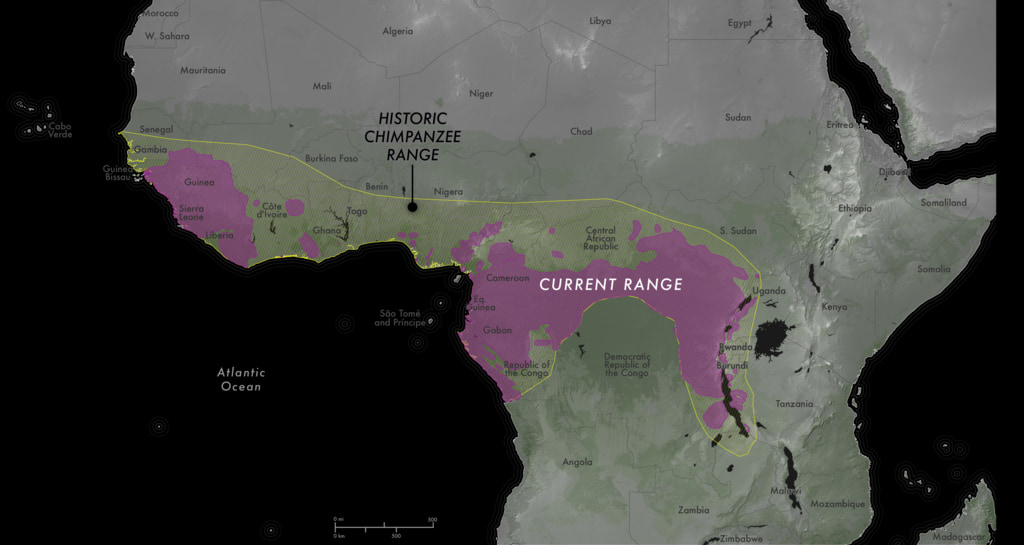
Chimpanzees heavily rely on forests, but with deforestation happening in Africa due to it changing for more agriculture, development, and other use the chimps are starting to lose their homes. Not only is this just happening to the chimps any animals that are in this environment are starting to struggle. The main purpose of this study was to find the most sustainable habitats for the chimpanzees in Africa, so that scientists were able to protect their populations more. As seen in the map the yellow represents the historic range that chimpanzees have been able to roam, and the pink represents the current range chimpanzees are about to roam. Just from this picture we are ale to see how much of the land has been taken away for human use, and how dangerous it is getting.
Garrison, Michala. “NASA Scientific Visualization Studio.” NASA, NASA, 13 Sept. 2023, svs.gsfc.nasa.gov
Zaroujtaghi, Ayda. “Beyond the Decline.” ArcGIS StoryMaps, Esri, 11 May 2026, storymaps.arcgis.com/stories/6bd041427d514764b99fbe91928b8b66?