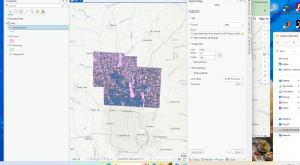
Makaylin Bailey
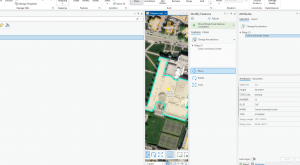
In Chapter 7, I learned how to create, edit, and delete different GIS features, including points, lines, and polygons. I also learned how to digitize features by using basemaps and existing layers as guides. The chapter showed how GIS can be used to update maps for places that are changing, such as the Carnegie Mellon University campus. I also learned about using lidar, GPS, CAD drawings, and other data sources to help create accurate GIS features. Another skill I learned was how to adjust and smooth features so that the map is more accurate and easier to use.What I learned from this chapter is that GIS editing and digitizing are important for keeping maps updated. I learned that different types of data can be used together to create accurate features and that GIS can help planners, engineers, and architects keep track of changes to buildings, roads, sidewalks, and other features.
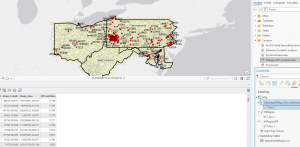
In Chapter 8, I learned about geocoding and how GIS can turn information such as addresses and ZIP codes into locations on a map. I learned how to geocode data using ZIP code polygons and street centerlines. The chapter also explained that addresses are not always entered correctly because people can make spelling mistakes, use abbreviations, or leave out information. Because of this, GIS uses fuzzy matching to find the closest possible match. I also learned about Soundex, which helps identify words that sound similar, and how geocoding uses scores to determine the best match.What I learned from this chapter is that geocoding is useful for understanding where people, customers, patients, or other data are located. I also learned that geocoding is not always completely accurate, especially when the original address information is incorrect. Checking unmatched or incorrect locations is important when accurate locations are needed.
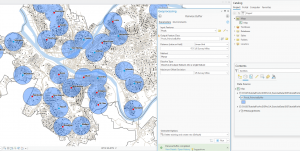
In Chapter 9, I learned how GIS can be used for spatial analysis instead of just displaying information on a map. I learned about buffers, multiple-ring buffers, service areas, facility location, and cluster analysis. These tools can help answer questions about distance, accessibility, and the best locations for facilities. The chapter also introduced network datasets, which can be used to estimate travel distance or travel time along streets. One example showed how GIS could help determine which public swimming pools should remain open based on how far people live from them. I learned from this chapter that GIS can help solve real-world problems by analyzing the relationships between locations. I learned that tools such as buffers, service areas, and network analysis can help organizations make better decisions about where to place or keep services. I also learned that cluster analysis can help identify patterns in geographic and demographic data.
Also Delware infor from week 5-
Parcel : This dataset consists of polygons that represent all cadastral parcel lines within Delaware County, Ohio.
Hydrology: This dataset consists of all major waterways within Delaware County, Ohio. This data was enhanced in 2018 with LIDAR based data.
Streetline :The State of Ohio Location Based Response System (LBRS) Street_Centerlines depict the center of pavement of public and private roads within Delaware County.