Chapter 1
Chapter 1 mostly explored the basics on how to use the program. I was taught how to navigate it on a basic level and what the different buttons did, essentially.
A couple different things this chapter had me do included:
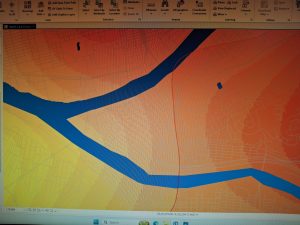
– Observing vector vs. raster layers, and how raster layers have visible pixels, and the vector rivers are smooth
– 
– Exploring highlighting specific features to make them stand out, or to look into data connected to the feature
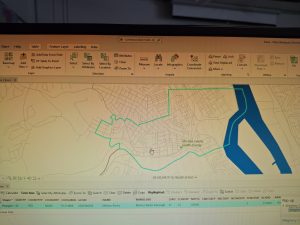
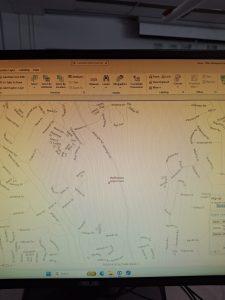
- Creating and looking at labels
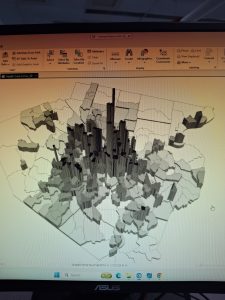
– Looking at 3D data, and how it really helps to show density visually, more than color alone.
Chapter 2
Chapter 2 explored different ways of presenting and examining data in a map. We explored things like use of different colors, different shapes for features, showing different labels and features at different levels of zooming, all to make the map more visually presentable and easy to look at.
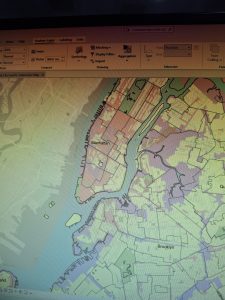
This is a simple example of some data showing up when you zoom in, but not when the map is zoomed out, so that it looks less cluttered.
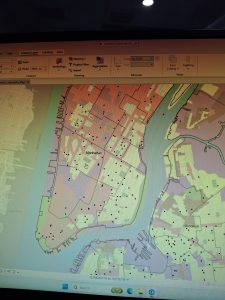
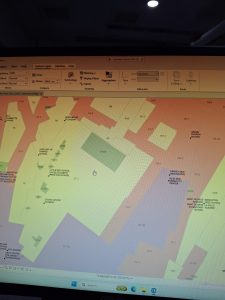
And here, even more zoomed in, we can see the text, but no longer the dots.
We also looked at ways to compare different sets of data without switching maps, with the compare slider. I liked that.
Chapter 3
Chapter 3 explored ways to present our data. We dove into ArcGIS Online and made a document of maps, charts that could be used for research, a story, a briefing, and a dashboard. We also learned how to share maps from the program to the online system.
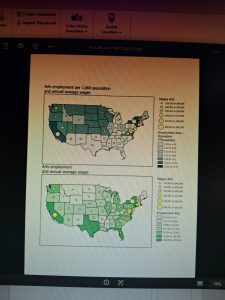
The document:
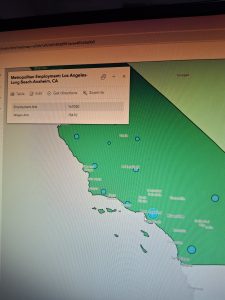
More work with Layers at different levels of zoom, but with fun pop-ups that are so fun:
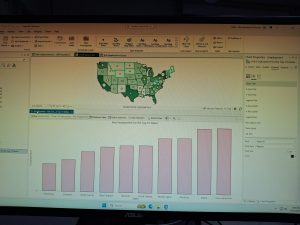
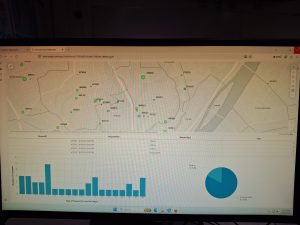
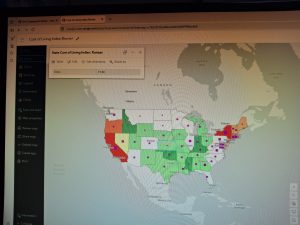
Some tables/charts made in ArcGIS Online:
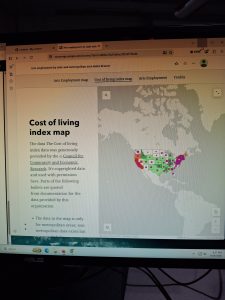
And some of the posts created (with templates):
Overall, these 3 first chapters served as a great introduction on how to use the program and I feel as though I am comfortable enough to work on a real project in the near future, once I get more used to all of the features of the GIS.