Part 1
*I reviewed the course syllabus and schedule to complete the GEOG 291 Quiz.*
Part 2
Hello! My name is Emma Dahlstrom and I am from Lexington, Kentucky. I am a sophomore this year at Ohio Wesleyan University. Currently, I am a declared Environmental Science Major and intend on eventually double majoring in biology or a related field. Although I do not know exactly what I would like to pursue after school, I have always been interested in working in the field of conservation. I am taking GEOG 291 not only for my major, but also because I have heard so much about GIS and was intrigued to learn more about it. Outside of my classes, I am on the university’s softball team and a member of Women In Stem.
Part 3
Originally I thought that GIS was just used in geography related fields and as a form of mapping. However, upon reading this chapter, I learned that its technology was used for so much more. One area that stood out to me particularly was how heavily it impacts agriculture. Coming from an agricultural based community, it was interesting to learn about all the ways GIS impacts its businesses. I was also surprised to learn that GIS was used in medical settings, planning cities, regulating commerce, e-governance, and so much more.
I also found it interesting the GIS had an identity problem. I was unaware that there are two sides to GIS: the “where” spatial entities are and the “how” we encode spatial entities and the repercussions of different methods of analysis on answers to geographic questions. This identity problem allowed them to differentiate the important difference of spatial analysis and mapping to me. Spatial analysis is extracting the information from spatial data while mapping represents geographical data in a visual form.
Although I was somewhat familiar with GISystems, I was unaware that there was a second face to GIS called GIScience. I learned that GIS is now widely considered a “black box” system because it has become so widely established that it is simply assumed to be true and justifications are no longer required. However, GIScience was established to research and question the accuracy and underlying assumptions of these systems. This established the point that when using GIS, you must responsibly analyze the data to reach an accurate conclusion.
Lastly, I found that the ability of GIS to visualize spatial relationships and objects makes interpreting the analytical pattern more accessible. This not only applies to the general public, but also to researchers as well. For example, the chapter details how the visual map of the cholera outbreak in London allowed epidemiologist John Snow to identify the location of the outbreak’s origin.
Overall, this chapter introduced me to the history of GIS and the vast amount of fields and problems that it impacts in our everyday lives.
Part 4
Source 1:
Owusu‐Sekyere, Adriana, and George Ashiagbor. “Mapping the Paths of Giants: A GIS‐Based Habitat Connectivity Model for Forest Elephant Conservation in a West African Forest Block.” African Journal of Ecology [HOBOKEN], vol. 63, no. 2, no. 70028, Mar. 2025, https://doi.org/10.1111/aje.70028.
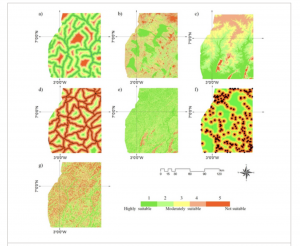
The Bia Goaso Forest Block in Ghana is home to a vital population of African forest elephants. Historically, the elephants had more extensive ranges and moved across a broader landscape. However, in recent years the population has been isolated which could cause several biological issues for the species. Through the use of a GIS-based habitat connectivity model, scientists were able to find a strong solution that enables the integration of landscape and ecological data on elephant habitat selection and movement. This map shows the variables influencing the choice of movement for the forest elephants based on proximity to water, land use, elevation, proximity to roads, slope, proximity to community, and terrain ruggedness. In addition, it details a variety of locations in the forest block that are suitable and unsuitable for forest elephants. By taking all of the variables into account and eliminating the unsuitable habitats for elephants, scientists were able to identify core channels and areas for elephant movement. This allows for the protection and maintenance of those pivotal areas for the conservation of the elephant species.
Source 2:
Kucsicsa, Gheorghe, and Cristina Dumitrică. “Spatial Modelling of Deforestation in Romanian Carpathian Mountains Using GIS and Logistic Regression.” Journal of Mountain Science [Heidelberg], vol. 16, no. 5, May 2019, pp. 1005–22, https://doi.org/10.1007/s11629-018-5053-8.
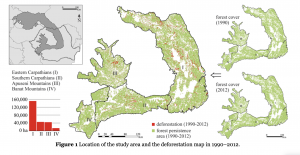
This study focused on the Carpathian Mountains which is an area of land that is heavily affected by forest loss. The goal of the study was to examine and analyze the various variables of deforestation in the area and to model the probability of deforestation through the use of GIS. This map displays the difference in forest coverage between 1990 and 2012. In the combined map, the persistent forest coverage stayed green, while the areas affected by deforestation were represented by red. This provides a clear visual of the affected areas. The map also sections off the area into four parts. This displays which parts of the mountains were being most affected by deforestation. By doing this, the scientists were able to identify the variables and their significance in the area. Understanding the driving forces of deforestation in affected areas allows conservationists to adopt appropriate policies and decisions in forest management and conservation.