Chlebowski – Week 1

Howdy!

My name is Gabriel Chlebowski and I am a junior zoology and environmental science major from Toledo, Ohio. Some of my interests include animal behavior, geography, music, sports, and kayaking. GIS has always been super fascinating to me since I have always loved maps growing up, so I am very curious about this course to see if my knowledge of the discipline can be expanded upon šŸ™‚

One of my favorite sections of Chapter 1 was explaining the human condition that it is easier for people to discern information through visual displays like maps as opposed to more textual approaches of displaying information like in tables.Ā  They point to a pretty straightforward but also slightly comical example of showing tuberculosis rates in a table format with percentages next to state zip codes. As strange as it sounds, without mapping software or a skilled cartographer, such data would be left in that format, which is very indigestible in my opinion.Ā  In addition, I did not know that not only do people “reason” using images, but such is processed differently in the brain that text. I think that the way that data can be processed via images is very special and really gives GIS great purpose in the realm of data analysis. This was especially true in the example of John Snow’s Cholera maps, a story in which I found extremely fascinating. The data by itself was not ample enough to draw any conclusions in where the source of the sickness arose, yet the use of mapping allowed Snow’s intuitions to lead him to the holes in the data, allowing for follow-up questions to reveal that the public wells were at fault. These types of stories are one of the many reasons why I find this type of data analysis so interesting. Maps can offer extreme amounts of information about a place or event that is much more in-depth and layered (pun) than a table with a contextual description. It takes extreme care and large amounts of precision to work the data into the visual in the correct fashion as to be the most presentable and apt as possible for the intended audience. Briefly mentioned in the chapter, the use of specific colors when discerning data is another way in which visualization can lead to more precise analysis, which is an area that extremely piques my interest.


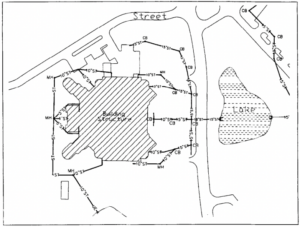
The first of the two GIS applications I found was an older report on seagrass abundance monitoring in the realm of dugong population health. The map accompanied from it is very old (article published in 1993), but it is very informative on the locations of seagrass off of the coast of Australia. The subject area is of interest for me as I wrote a research paper on factors that negatively affect dugong population size, in which seagrass availability and quality were of the upmost importance. ļæ¼

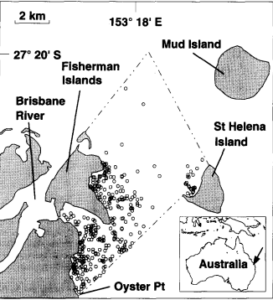
An efficient method for estimating seagrass biomass – ScienceDirect

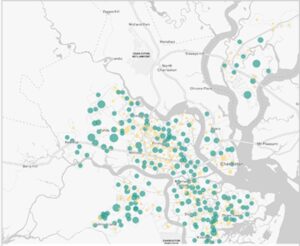
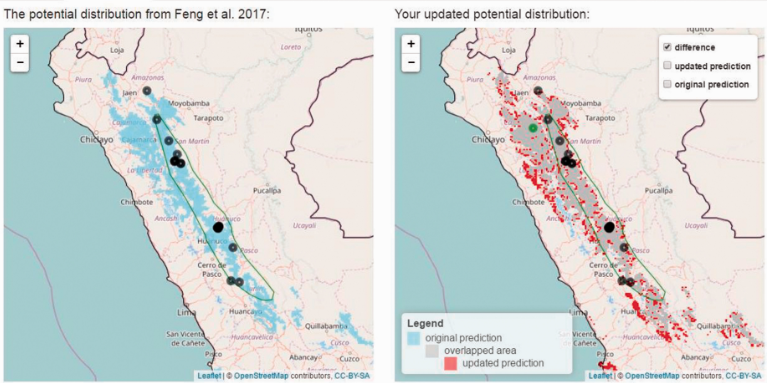
The second application is a type of online armadillo occurrence tracker called Armadillo Mapper (AM). This GIS tool automatically makes a range map of armadillos in the subparamo habitats of Peru based on user online input that shows on the map as potential occurrence. This is important to the knowledge of the hairy long-nosed armadillo (Dasypus pilosus), as their compiled map shows a larger range than the established one by the International Union for Conservation of Nature (green circle on both maps).

Armadillo Mapper: A Case Study of an Online Application to Update Estimates of Speciesā€™ Potential Distributions – Xiao Feng, Mariela C. Castro, Evan Linde, Monica Papeş, 2017 (sagepub.com)

Sources:

Feng X, Castro MC, Linde E, Papeş M. Armadillo Mapper: A Case Study of an Online Application to Update Estimates of Speciesā€™ Potential Distributions. Tropical Conservation Science. 2017;10. doi:10.1177/1940082917724133

Long, B. G., Skewes, T. D., & Poiner, I. R. (1994). An efficient method for estimating seagrass biomass.Ā Aquatic Botany,Ā 47(3-4), 277ā€“291. https://doi.org/10.1016/0304-3770(94)90058-2

ā€Œ

Bechina – Week 1

Hello! My name is Lily Bechina. I am a freshman environmental studies major. I am from Chicago, Il. I became interested in the environment over covid lockdown. I found the effects from everyone staying indoors (very little travel) for a year very interesting. I went on to take an environmental studies class my senior year of high school and really enjoyed it.Ā 

Schuurman ch.1 Response

I found the reading from Schuurman very interesting. I really didnā€™t know anything about GIS and how it works so the reading was very helpful in understanding what we will be working with in this course. Although the diction could get technical at times, I still understood what I was reading and was able to take a lot away from it. The comparison made between GIS and calculators helped me to understand the uses and benefits of GIS technology. GIS must be used with an understanding of what is being modeled and how it is being done to be used properly.Ā 

Learning about how people use GIS differently and see different purposes/functions for it was eye opening to how complex the technology really is. I enjoyed reading about how GIS technology allows for unspecific data to be utilized and interpreted.Ā Ā 

For GIS being such an intricate piece of technology, it produces something that people form their opinions off of in a more abstract way. Schuurman describes it as ā€œunscientificā€ while also pointing out that forming opinions based on the visual aspect is supported by some researchers.Ā 

Although this is a small detail, I appreciate the author using the word ā€œshe,ā€ when making a statement about GIScientists in general. The author is a woman herself, but it honestly caught me by surprise. Furthermore, I enjoyed the mention of GIScientists’ questioning if the technology is gendered and even touching on the social side of GIS technology. That dynamic is something I would love to learn more about.

Reading about GIS as a language that is much harder to understand and use than the English language helped me to see more of what exactly GIS technology has to offer. It honestly made me somewhat nervous about my own use of GIS because learning and understanding a new language is not quite easy.Ā 

GIS Applications

One GIS application I found is for disaster management. Technology is used to study disaster patterns over time. It helps to understand the ways in which certain areas of land are impacted by disaster and better help to reduce damage in the future.Ā 

Another GIS application I found is for water resources. This application helps to predict where pollution may come from. With that, the pollution can be hopefully avoided. It also helps to watch the flow of polluted water and infer what that water will go.

Sources:Ā 

Faisal, A., & Khan, H. (2018). Application of GIS and remote sensing in disaster management: A critical review of flood management. In International Conference on Disaster Risk Mitigation.Ā 

Tsihrintzis, V.A., Hamid, R. & Fuentes, H.R. Use of Geographic Information Systems (GIS) in water resources: A review. Water Resour Manage 10, 251ā€“277 (1996). https://doi.org/10.1007/BF00508896

Floyd Week 1

Hello, I am Keegan Floyd. I am a freshman planning on majoring in Genetics, with a possible double major (or at least a minor) in Data Analytics. I apologize for the picture; I put a mask on in 2020 and havenā€™t taken it off for the very few photographs taken of me since, so you get this picture of me hiding in my closet. I am taking GEOG 191 for two reasons; first, in an effort to broaden my academic horizons to see how different fields intersect with my chosen areas of interest; second, this is a useful skill set to have if I lean more into bioinformatics in my future career.

I found the first chapter of Schuurmanā€™s Introduction to GIS to be surprising, as my knowledge of GIS and geography, in general, was almost nonexistent before signing up for this class. I was not aware that a system designed for geography could intersect with so many other scientific fields, influencing large parts of my daily life through its importance in agriculture, urban planning, and healthcare. The uses of GIS in public health surprised me the most; it just never occurred to me that it is necessary to use geographical data to define and analyze health at the population level.

Ā I appreciated how much detail the chapter included on the two ā€œsectionsā€ of GIS: GIScience and GISystems; I believe that portion of the chapter deepened my understanding of the subject by showing how the two intersect via examples of both in day-to-day life. I am curious to see which of the two sides of GIS we learn more about in this course, though if I had to guess, it would be GIScience due to its position as the underlying theory behind GISystems.

This passage encouraged me to think about the applications of GIS within my major, which lead to my fascinating discovery of just how much population genetics relies on mapping systems to analyze data and predict research outcomes. This fact reassured me that this course will be beneficial in my future endeavors despite how different it is from my typical major-related classes.

This chapter opened my mind to the idea that GIS is not a simple information system, as the name suggests, but rather a broadly defined concept with more applications than could possibly be included in a single definition. I am looking forward to wrapping my head around this system throughout this course. Overall, this chapter has helped me gain a better understanding of what I need to know and what questions I need to ask to succeed in this course.

I used google scholar to look into the applications of GIS concerning genetics and came across an article about the use of GIS technology in landscape genetics. This article talks about utilizing GIS to map genetic variance in several different species across a large area to reach a level of visualization of data that was previously much harder to attain. These maps can be used to find patterns of gene flow within and across species.

My second topic of interest was GIS in relation to public health. I found an article discussing how GIS is particularly useful in the prediction of parasitic disease spread through the mapping of parasite appearances and the population density in an area. There is no accompanying map for this article.

Sources:Ā 

Fletcher-Lartey, S. M., & Caprarelli, G. (2016, February 2). Application of GIS technology in public health: successes and challenges. Parasitology, 143 (4), 401-415. Doi: 10.1017/S0031182015001869

Vandergast, A. G., Perry, W. M., Lugo, R. V., & Hathaway, S. A. (2010, August 16). Genetic landscapes GIS Toolbox: tools to map patterns of genetic divergence and diversity. Molecular Ecology Resources, 11 (1), 158-161. https://doi.org/10.1111/j.1755-0998.2010.02904.x

Munroe – Week 1

Hi! My name is Jonathan Munroe and Iā€™m a junior from St. Louis, Missouri. Iā€™m majoring in geography with a minor in music performance (violin). Iā€™ve taken quite a few classes regarding GIS but Iā€™m excited to take this course specifically on ArcMap. After graduation Iā€™d either like to work for a nonprofit urban planning agency doing neighborhood revitalization without displacement or work making maps out in the woods for the forest or national park service.

Schuurman Chapter 1- Introduction to GIS: I found this passage very interesting, as Iā€™ve read about the history of map-making and remote sensing but Iā€™ve never learned about the history of GIS. The program itself is so versatile and especially in todayā€™s age, itā€™s widely popular and sought after. As an example, last year when I worked at the Flying Pig I was talking about my major to a customer who worked for Nationwide in Columbus. He told me that if I got a degree or certificate in GIS I should come to him and heā€™d have a job ready for me. While insurance isnā€™t a field Iā€™m interested in, I think the story speaks volume and adds on to Schuurmans emphasis on how popular GIS has become in recent years. Another thing I found fascinating was his topic of visualization where he said ā€œvisualization is used to manufacture meaning from dataā€¦people are able to discern information from visual display with greater facility than from tables or printed text.ā€ Iā€™m a visual learner myself and think my love for maps stems from my availability to understand the data. Schuurman further proves his point by saying that ā€œpeople ā€˜reasonā€™ using imagery. GIS can better connect, market and convey any information, which is why itā€™s so sought after in the job market. This reading has made me excited to take this class through the semester and become more knowledgeable and familiar with GIS, helping me excel my research skills, resume and general knowledge.

For my map, I chose to look at the racial segregation of Cape Town, South Africa with the failure of the Group Areas Act of Apartheid. I chose this map because Iā€™m currently writing a TPG to visit Cape Town regarding racial housing segregation in comparison to the Red Line Policy of the United States. This map shows the racial composite of Cape Town using census data from 2011.

Richardson – Week 1

Hi Everyone! My name is Eliza Richardson, and I am a senior majoring in Environmental Science and International Studies, from Lakewood, Ohio. I love to cook, workout, and spend time outdoors doing anything from hiking to sand volleyball to laying on the beach šŸ™‚ I am excited for this class because I have always wanted to grow my GIS skills, and I think it would be very beneficial for me moving forward in my career after graduation. After graduation I plan on taking a gap year before attending a masters program for environmental policy and sustainable development!Ā 

Schuurmans Chapter 1- Introduction to GIS exemplified how versatile and important GIS can be in the academic, research, and professional world. One of the great things about GIS is that it can be used for such a wide array of topics, that it can serve almost any field of study. Schuurman points out that a significant distinction of GIS is that it is more about ā€œspatial analysisā€ as opposed to simply ā€œmappingā€. Categorizing this kind of work as spatial analysis allows us to think more externally about how we want to be expressing certain kinds of information and data, and how to most effectively. However, Schuurman explains how GIS wasn’t always so interdisciplinary. At the beginning of its development, many people argued about what was the proper use of the technology ā€“ should it be used by those who are looking to analyze spatial data, or should it be used by those who are looking to print physical maps? I also thought it was interesting how Schuurman talks about how the development of GIS is important for both social and technological developments. With all of these varying views on the implication of GIS in the world, I think that this is one of the reasons why I am interested in learning more about GIS; it is so versatile in every field, and can be used in more ways than one would ever picture.Ā 

The concept of GIScience is really interesting to me. Often times, when I have struggled with creating material in GIS before, I feel as though the reason why I had struggled was because I didnt completely understand the concept of what each step was doing with my data, therefore I didnt comprehend how to connect it all together, and know what step to take next. I think that if GIScience was briefly touched on when learning about this system and the projects we will be doing, I think it would help people to better understand why they are performing the functions they are in GIS, and will help them apply their knowledge to future projects.

In looking at GIS applications, I looked at the correlation of giant panda populations and the amount of deforestation and human impact in areas of giant panda habitat in Central and Western China. I found that GIS can be used to map anything from the density of mammal populations, to the suitability of habitat for giant pandas, to the areas of the region that are experiencing the greatest effects of human activity such as the building of roads through dense forests. Figure 6 from GIS application in evaluating the potential habitat of giant pandas in Guanyinshan Nature Reserve, Shaanxi Province, shows the level of human impact from residence, to roads on a nature reserve for giant pandas in the Shaanxi Province.Ā 

https://www.nature.com/articles/s41598-018-37447-0#Fig1

https://www.researchgate.net/publication/241124153_GIS_application_in_evaluating_the_potential_habitat_of_giant_pandas_in_Guanyinshan_Nature_Reserve_Shaanxi_Province

Hollinger Week 1

Iā€™m Lauren and Iā€™m from Canton, Ohio! Iā€™m a freshman majoring in Data Analytics (and thinking about adding geography as my second major!) I love to ski, kayak, hike, camp, and play tennis in my free time.g

I thought the Schuurman Ch. 1 reading was very interesting, especially because of all the applications of GIS it described. I especially thought the applications of water reservoirs and natural gas fuel lines were interesting. I was recently at ODNR, and I got to talk to them about how they use GIS and data for the Canalway and other water sources in Ohio as we are a part of both the Lake Erie and Ohio River watersheds. So, that portion of the reading really helped me tie that experience and the course together. On top of that, the reading also references some applications I never would have considered at the beginning ā€“ like its use in Starbucks stores! I also thought the history portion of the chapter was engaging. Learning about the history of using tracing paper and a light table was insightful into the very beginnings of GIS. I also found the part about the original resistance to GISystems and how it eventually became accepted without a second thought over time in the ā€œblack boxā€ portion of the chapter. I also was surprised by the distinction between GISystems and GIScience. I did not know that there were two terms, but I appreciate the explanation of how both are important and work together. In this regard, I thought the notion that GIScientists constantly question the efficiency of the GISystems algorithms was super important. Algorithms can be so flawed when we make them even if we donā€™t notice them at first. In, high school I wrote a report on racism in the medical field and found that with organ donation algorithms, they favored white individuals over half the time. This always makes me think about how important it is to constantly keep an eye on and reevaluate the algorithms we make because often they include our own underlying biases, and we implement them anyways. Thus, I appreciate the aptitude of the book to explore this same notion and its truth for GIS algorithms.

The first GIS application I looked at was food deserts. Canton is a food desert, so I have always been interested in how to effectively view the impacted areas. Last year, a researcher from Ohio State came into one of my classes and showed us the maps he had compiled on Canton as a food desert. Thus, after I read this chapter and thought back to that class GIS came to mind. USCā€™s spacial science institute had a whole website on how they use GIS to study food desserts. They have mapped everything from the availability of produce and distance and rigor of the path it takes to get to a store. They cross-apply this with maps of income levels and people who own vehicles or other means of transportation. In one study done in Chicago, their researchers found that low-income neighborhoods had significantly less access to food and more poor-quality food compared to upper-class neighborhoods.

Another application I came across was for ski resorts. The application is called Snow Mappy and it was created when the founder decided she wanted a better way to view ski resorts than just a paper map or a sign at the top of the hill. Mappy uses GIS to map things like velocity, and skier speed on certain trails by level, density, and concentration of skiers on certain trails. The application can be used by skiers to track their location and different resources on the mountain as well as the resort itself to track its staff and decide if certain trails need to be added or changed based on where people ski. The map below is the map that displays skier density on trails based on skill level:

https://gis.usc.edu/blog/overcoming-urban-food-deserts/

https://www.esri.com/en-us/lg/product/stories/mappy-develops-mobile-application-for-ski-resorts-with-arcgis-velocity

Skidmore Week 1

Hello, I am Connor Skidmore from Bellefontaine Ohio. I am an Environmental Studies major and a member of the Cross Country and Track teams.

InĀ Schuurman Ch.1 the author begins by discussing the wide range of modern uses of GIS. They describe GIS as a system used by many but not understood for what it is to the public. The history of GIS seems very confusing because it started as a standard practice done by cartographers that quickly became a digitized field. All around the same time, people from different parts of the world started to make similar systems that today are the foundations of the modern GIS system. The author states that GIS would have been inevitable without interest from Geography but I do not see how that is true because the base field of understanding the information is needed. Even the definition of GIS is very convoluted based on the person and their needs with the system.

This chapter as a whole gave me the ability to understand that GIS is more of a broad net that covers a ton of information rather than one stable thing. GIS is shown in the chapter as a broad and sweeping term that is applied to certain things that by themselves are convoluted. Two people can both use GIS but come up with two very different understandings of the software and its use cases. To me, the history of GIS seems to be a known yet unknown variable based on the chapter because if so many different fields and researchers were doing the same things at the same time how did they finally decide to make the broad sweeping net? This is in my opinion why GIS can have so many different definitions and use cases because the history of it comes from many different people who at the time were doing very different things.

I enjoyed reading this chapter though because it provided a unique into GIS. The chapter also showed how GIS itself is confusing to understand as a whole.

Since I have an interest in City Management I used the keyword City in my search for GIS applications. In my first article, I found that GIS was being used to find if rooftop wind turbines were feasible in Bari, Italy. Since Europe and the Bari have had increasing discussions in “Smart Cities” and energy the study was born to find if rooftop wind turbines were feasible.

In my second article, it discusses how GIS would be used inside of “Smart Cities” which are described as cities that are on the cutting edge of technology and developing new technologies. These cities would use GIS to optimize planning throughout all sectors of the cities while the businesses that innovate in these cities would use GIS to create new technologies.

Sources:

  1. https://doi.org/10.1016/j.rser.2016.12.005.
  2. https://doi.org/10.1080/10095020.2013.774108

Dodds – Week 1

My name is Ellie, I am a sophomore environmental science major. I am from Louisiana but was born in Columbus. I love nature and being outside so it was easy for me to decide what to study.Ā  I decided that GIS would fit well with my major. I am so considering adding a geography minor. I don’t have many photos but this is one of me from marching band this year!

My knowledge of GIS is limited so I really enjoyed the breakdown provided in Schuurman chapter 1. The first thing that stood out was the wide success that GIS has had on our society compared to the lack of knowledge the typical person has on GIS as a whole. It has been integrated into a vast range of disciplines such as: disease tracking, archeology, and consumer based markets such as coffee shops like Starbucks.Ā  We discussed the use of maps as a form of influence in Human Geography and I did not realize exactly how much influence GIS could have at the time.

I had no idea there was controversy regarding GIS. The chapter gave a very inclusive and blunt overview of GIS and theĀ  positives and negative. I enjoyed the point of view the author provides as someone within the geography community. I learned GIS is viewed differently by people within the community. Some view it as just an application and others view it as a science. The common ground between GIsystems and Giscience is the practices that defines them. GIsystems is often stated to be the data input, special analysis and mapping side of GIS. GIscience was more defined as the theories behind the system. I will be curious how I feel about this distinction after I take more geography classes.

The technicalĀ  history was my least favorite section to read but it is important to know. The fact that GIS got its beginnings prior the the rise of computers was something I had not considered as a possibility. It does make sense in hindsight though. I would enjoy learning more about the evolution of GIS as computers evolved in the early 2000’s.

I searched “GIS application honey bee” and found an article published in 2019 “High-resolution maps of Swiss apiaries and their applicability to study spatial distribution of bacterial honey bee brood diseases” This article describes the lack of GIS application to study honey bee diseases and gives the first step towards standardizing the use of GIS in Europe by providing high-resolution maps of the apiaries. This article was also highly cited in recent years.

Apiary densities (ā€˜density-indicesā€™) on municipal level.


Cite

on BĆ¼ren RS, Oehen B, Kuhn NJ, Erler S.Ā 2019.Ā High-resolution maps of Swiss apiaries and their applicability to study spatial distribution of bacterial honey bee brood diseases.Ā PeerJĀ 7:e6393Ā https://doi.org/10.7717/peerj.6393

I also decided to search “GIS application East African Rift Systems”. I did a research project on the EARS for physical geography and I knew there would be some overlap.Ā  I found the article “Impacts of Mau Forest Catchment on the Great Rift Valley Lakes in Kenya” . ThisĀ  discusses the deforestation and its relation to the reduction of water in the lakesĀ  in the area.


Cite

Boitt, M. (2016) Impacts of Mau Forest Catchment on the Great Rift Valley Lakes in Kenya.Ā Journal of Geoscience and Environment Protection,Ā 4, 137-145. doi:Ā 10.4236/gep.2016.45014.

Buroker Week 1

Hi! My name is Ben Buroker and I am a junior at OWU. I am an environmental studies and geography double major with a minor in Spanish. I love being outside hiking, surfing, running, swimming, and skiing and am on the lacrosse team.Ā 

The first thing that strikes me about the PDF was the multifaceted applications of GIS. I hadnā€™t made the very obvious connection that the police or car navigation systems would be using GIS. I am slightly confused about the section in the beginning of the reading where they talk about who the reading is made for. The use of the phrase ā€œcatholic encompassing interested physical and social geographerā€ is throwing me off because I donā€™t see how this connects to the framing of this reading. It also strikes me how important and useful GIS is for state/local governments or municipalities. I thought that the explanation of how ā€˜layersā€™ first started was really interesting. I actually feel like it makes me understand the layers that Iā€™ve put into GIS more than before. I don’t even want to think about the level of intelligence and thought and design that went into developing a GIS system. The section about ESRI solidified for me how beyond my scope of interest the computer science side of GIS is. I appreciated the section on visualization and the amount of importance they give to visualization when working with GIS. In my experience, being able to properly convey information through your maps is the most important piece of the puzzle. It doesnā€™t matter how well you know the program, or how fancy you can make your map, if people donā€™t understand it or are unable to contextualize or get any meaning from it. The field of GIScience is interesting to me. Are we in this class doing GIScience? When, if ever, is working with GIS not GIScience? I am interested in the section on B2B and B2C portals and the role of GIS in them. Iā€™ve never heard of GISā€™s effect on businesses in this manner and would be interested to know what GIS specifically allows businesses to do nowadays versus 100 years ago. Iā€™m almost positive the power of GIS and what businesses have access to is intimidating.

I read an article about the myriad effects that GIS can have on agriculture, specifically about agricultural and natural resource management. Things that GIS and remote sensing (drones) can help with are crop inventory, crop yield analysis, nutrient and water stress, and land use and land cover.

Source: Marshet Nigatu Gebeyehu, 2019. “Remote Sensing and GIS Application in Agriculture and Natural Resource Management,” International Journal of Environmental Sciences & Natural Resources, Juniper Publishers Inc., vol. 19(2), pages 45-49, May.

My second article is about applying GIS for solar power plant site selection in Makkah, Saudi Arabia. The article discusses the current demand for electricity in Saudi Arabia and the unique geography that allows solar to be such a worthwhile investment and option for this specific area. It also discusses how GIS was used to generate a number of maps that were relevant to the study. They were looking at different locations to build test sites, and needed to know about ground elevation, the roads, and the electric grid in the surrounding area.

Source: https://www.scirp.org/journal/paperinformation.aspx?paperid=115795

Nair – Week 1

Hey everyone, I’m Aninditha Nair(I know it is hard to pronounce so “Anin” works just fine) I am a freshman, majoring in Computer Science and Data Analytics and minoring in Environmental Science and Dance. I’m from a small town near Mumbai, India. Currently, I’m involved in the Campus Programming Board and Horizons International. I want to learn GIS because I really want to understand new facets of environmental science and technology.

Reading Schuurmanā€™s chapter one gave me an insight into GIS and helped me connect it to my specific interests. I found it interesting that GIS is used so extensively around the world, especially for organ donations and epidemiology, which I had no idea of. It is also amazing how different people in different countries implemented GIS in one form or another and how it is called an inevitable development. I liked the mention of spatial data analysis because, during ENVS110, my TPG proposal project made use of spatial data to analyze marginalized communities for flood risk and management.

I had a misconception that GIS was all about geography and cartography, and even though those constitute a lot of it, it was nice to see so much computation and technology being involved in the process. I also think it is interesting to notice that GIS now often refers to Geographic Information Science and not Geographic Information Systems. I didn’t know that GIS had two different types of identities. The black box identity seemed intriguing to me, and how researchers were more curious about what underlies the technology than the application of existing technology.

Reading the chapter also made me realize the similarities between GIS and my data analytics class. GIS allows the visualization of spatial data and also provides a means of utilizing fuzzy data. Similarly, for Data Analytics, we accumulate data and visualize it to analyze further and find better solutions. I’m also amazed to find out that India is at the forefront of e-governance technologies and implementation using GIS(I swear I’ve lived in India all along, I’m just dumb). In the end, the chapter summarized every single chapter in the book in a succinct manner. I feel more comfortable and prepared with the course now that I have a small gist of what the entire book is going to be about.

For the GIS applications, I looked at the application for Racial Equity. I specifically looked at ESRI GIS HUB and their ways of addressing racial inequalities. They go through a four-level-process: Engage communities ā†’Map and analyze inequities ā†’Operationalize best practices ā†’Manage performance. They use maps and spatial analysis to reveal and understand inequities in experiences and outcomes within communities. Another application I found interesting was the application for Climate Models. I was unaware of the fact that GIS and Climate Modelling could be so intertwined. A GIS-based analysis of the tornado in Joplin, Missouri, in 2011 shows how combining weather and climate information can be useful when it comes to answering questions like, “How many miles of roadways were in the tornado path?”, and “Which roads likely need to have signs replaced or debris cleared?”Ā 

Sources:

https://gis-for-racialequity.hub.arcgis.com/

https://www.esri.com/about/newsroom/arcuser/mapping-and-modeling-weather-and-climate-with-gis/