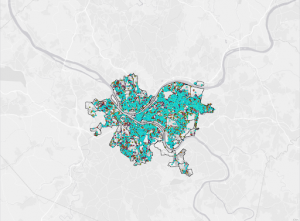
Nagel Week 4

Chapter 1

  • 1.1: Took forever to get things up and running, granted I can barely work a calculator, let alone a computer. Once things did work though, the introduction was simple and didn’t take long to finish.
  • 1.2: Seeing the different variations and attributes are interesting, but it takes a long time to actually get there and get the different options selected or deselected.
  • 1.3: While I do like to be able to see where the data comes from, there’s a lot of information and it takes a considerable amount of time to navigate through everything to get to the right thing.
  • 1.4: The 3D view and different symbols/colors for different areas are interesting, though figuring out how to vertically rotate the 3D view was a challenge.   

Chapter 2

  • 2.1: Changing the colors and the different options on the palette are cool, although the end result did not entirely look like the picture in the book.
  • 2.2: Section teaches how to label features and change labels. I was not certain I did it right though as no name popped up over the West Village area.
  • 2.3: Slightly more time consuming than the others as changing from tab to tab to change color and symbol is fairly tedious
  • 2.4: Initially broken at first as the neighborhood content section was corrupted and had to be repaired. Was also unclear in asking to move the one tab above the 3D section and not on top of it instead.
  • 2.5: A short section but it did not work. There was no template section nor an area in which I could choose different shapes from as there was prior.
  • 2.6: I suppose learning how to import layers is going to be important at some point. Splitting between the two layers was interesting to see though.
  • 2.7: Short so not much to say for this one other than that there is something inherently satisfying about dot graphs.
  • 2.8: Short but a little confusing as I thought for a minute I had done the same thing twice in a row

Chapter 3


  • 3.1: This one was a struggle to get through. Trying to get parts of maps and labels to snap to an axis was difficult, and a lot of different tabs to navigate through.
  • 3.2: Now I’m even slightly more confused. Took me some time to figure out how to share it, but doing stuff on WebGIS rather than the actual program.
  • 3.3: Took an extremely long time to do, and I’m not very confident in having my work shared online for all to see.
  • 3.4: Shorter and a bit more clear in what it wanted, but halfway through I got stuck with the dashboard as I was unable to find the option to delete x and y value fields.

Hagans Week 4

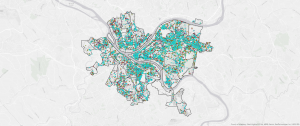
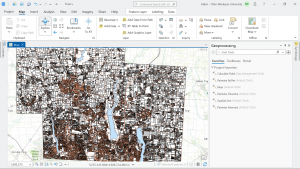
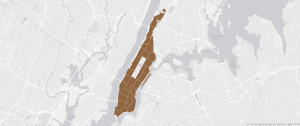
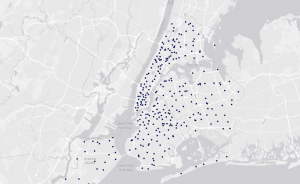
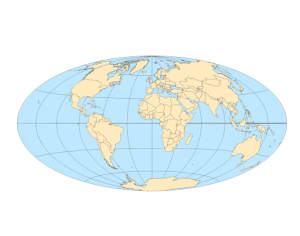
Chapter 1- Overall, I think this first chapter was a very good introduction to ArcGIS and I’m now more familiar and comfortable with GIS techniques. I like how the book is very explicit with what to do, but also explains how what it’s telling you to do will change the map. Also, I enjoyed the “Your Turn” sections throughout the book so far, because as the book explained, it really helps with the muscle memory of performing these actions and forces you to learn to do things on your own. I also think these gave me a better understanding of where everything is located on ArcGIS Pro. The first few tutorials were focused on showing us how to move around and navigate a map using the Explore button and bookmarks. Additionally, Tutorial 3 showed me how to click on a data point and pull up the summary statistics. Tutorial 4 was very interesting because it taught me how to add, label, and remove a feature class. We also made 3D maps, which is a really interesting way to visualize the data. Below are 2 images comparing the map of 2D data to the map of 3D data. The end of this chapter focused heavily on symbology and assigning unique symbols that can help distinguish between feature classes. This section familiarized me with the Symbology pane and how to change the map’s visuals. Overall, I didn’t have any problems with this chapter and I enjoyed putting what we’ve been reading about into practice. 

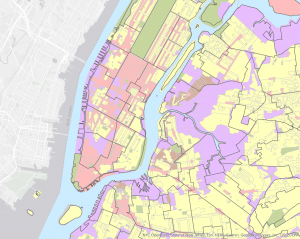
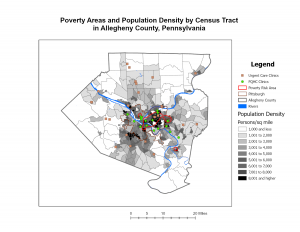
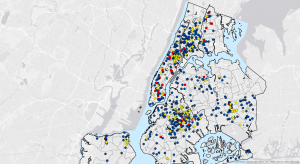
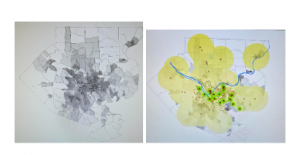
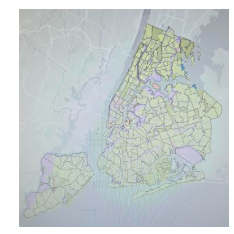
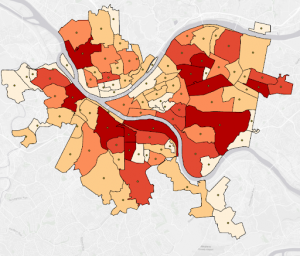
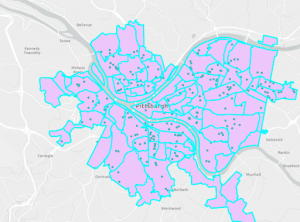
Chapter 2-  The second chapter was still fairly easy, but I think it was a little more challenging than Chapter 1 and I did run into a few problems. Overall, the chapter went more into depth about symbolizing maps, using graduated symbols, scales, and dot density maps. I think the most confusing part of this chapter was choosing which methods to use in choropleth maps because it seems like you would need a pretty good understanding of statistical concepts like data distribution. I was just pressing whichever method the book told me to, but if I had my own set of data with a particular distribution, I’m not sure I would know which scale or method to assign it that would display it the best. Another slightly confusing part of this chapter was the definition query because I think this part may be a little too computer science-ey for me. I learned how to remove duplicate labels, change font size and color, and more about 3D maps. Another cool thing this chapter taught me was how to change the Visibility Range of a feature layer so that it can appear or disappear when you zoom in or out. I think that this aspect of ArcGIS helps with navigating the map and reduces the cluster and busyness by only presenting data when you’re zoomed to the correct visibility range. Below is a picture of some of the feature layer labels when zoomed in. The other picture shows the colors of the map that are displayed as Unique Values with some cool colors.

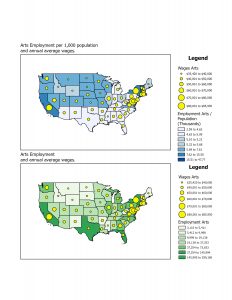
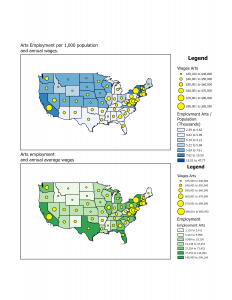
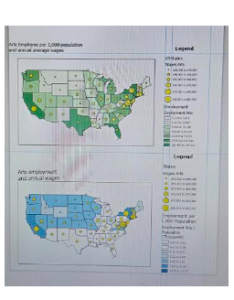
Chapter 3-  Chapter 3 was interesting because it incorporated the web version of ArcGIS. This chapter started out by teaching us how to make a map layout, add legends, use the ruler to line things up, and export a map. I liked learning how to make the map layouts because I think this would be important for using a map for an educational purpose and presenting it to people. This chapter also taught me how to create a chart based on the data from the map. I have a picture of one of the graphs below, and I thought it was cool how you could select certain data points within a feature layer to include in the graph. This graph only shows the employment of 10 states, rather than all 50. Once again, I think this is an important technique that allows you to visualize the data better and look at trends without being overwhelmed by an entire dataset. After this tutorial, they switched to ArcGIS Online, which I have some experience with, but not as much as with ArcGIS Pro, so there was a bit of a learning curve, but luckily it seems pretty intuitive. I think the web version is very user-friendly and easy to use, but seems to lack some of the more advanced features of ArcGIS Pro. This section taught me how to share a map on ArcGIS Online and how to create an ArcGIS StoryMap. Creating a StoryMap seems fun, but I think it would be even better if I weren’t copying and pasting random text into a box and I was using my own words, maps, and data. Nevertheless, it was a good way to introduce how to use ArcGIS Online to reach a broader audience because of its cool visuals. Below is a screenshot from the ArcGIS StoryMap it had us make, where we could upload a map from ArcGIS Pro that can be navigated online.

Mulloy Week 4

Chapter 1

1-1 — I do not have any questions or comments on this chapter overall. I am very confident in my computer abilities and knowledge, so learning this program has been very easy for me, as much knowledge has transferred over.

1-2 — This section was very simple and mostly just covered how to navigate the  programs menus and maps.

1-3 — This tutorial was about learning how to use the attribute tables and the summary statistics tool to get statistical information from the map.

1-4 — This section was all about learning how to label things and add or change symbols for features. I could not get the 3d Map to open.

Chapter 2

2-1 — This taught how to assign different colors to different feature classes.

2-2 — This taught how to label features and change the label properties. It also teaches how to manage pop ups when selecting a feature.

2-3 — I found the part regarding setting each symbol to a different shape and color tedious from previous sections, however knowing how to separate features based on other classifications is very useful. 

2-4 — For this one, I ended up running into a problem where the source data was not set for the “Neighborhoods” layer, and I had to manually set it. Luckily, it was pretty easy to find it, because the file paths were all named logically.

2-5 — This was a very short section on a very simple concept that expanded off previous ones, just using symbols to explain

2-6 — Learning how to import settings from a different layer and apply the same parameters to another layer is incredibly useful for comparing the two layers.

2-7 — This section showed how to use density dot maps, which is the other density map we learned of in the previous book.

2-8 — This taught how to adjust which features/labels can be seen from different zoom levels. This is very useful to prevent clutter, however I wish other virtual maps allowed me to change these min/max of visibility. I often find myself unable to determine what area of a map I’m looking at when zoomed too far in. 

Chapter 3

3-1 — It’s strange, I feel, that map layouts were introduced at the very beginning and are not mentioned again until this point.

3-2 — Using WebGIS was a nice change of pace. I feel this is far simpler to navigate than Desktop, but it also feels more limited.

3-3 — I quite enjoyed being able to learn how to display my data in a meaningful and organized way, even if they did just tell me to copy and paste everything.

3-4 — This final section of this chapter was about how to create and assign data to graphs, charts and dashboards. It was quite interesting and at this point of the class it feels like we’re getting to the point where this information can really be applied to the real world and used in meaningful ways.

Howard Week 4


Disclaimer: I do not have access to the book right now, just the files and the screenshots, so I am going from memory when discussing the tutorials because I don’t want to ask to take away one of the class copies while everyone who has them is working hard. I am using a lot of screenshots to prove I did the material since I can’t talk too much about what each tutorial was like.

1-1: I liked that this tutorial culminated into a finished product by the way of that image. It helped me make sense of everything better.

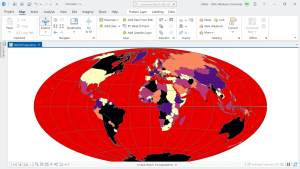
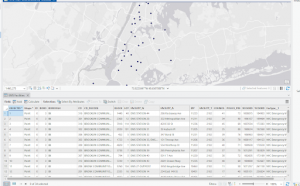
1-2: Screenshot (8).pngHere is the finished table for this tutorial. I feel like learning about tables will be very useful.

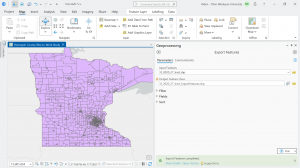
1-3: Screenshot (9).png I don’t really remember much about this tutorial unfortunately, but I think it was about tables again.

1-4:Screenshot (10).pngThe 3-d aspect was really cool! It’s really interesting to me how these graphics work and how the 2-D map I was acquainted with transformed into this.

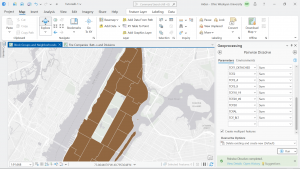
2-1:Screenshot (11).pngI enjoy working with symbology, that process seems to make more sense to me than others. Plus, it just looks nice.

2-2: I believe this one was making mini-labels to label each different color/type of land use. I like that you are able to do that, I think it makes identification of your contents easier.

2-3: Screenshot (12).pngAnother example of correct symbology.

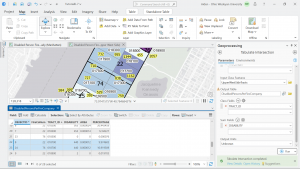
2-4:Screenshot (13).pngThe field that the book asked for was not popping up for me in any way for some reason, so I attempted to use the ObjectID one which must have been a very wrong choice because my final result was no colors and nothing popping up on the map. I wasn’t able to really do this tutorial.

2-5: Screenshot (15).pngBack on track with this tutorial, I was able to actually do this one. Here’s yet another screenshot of symbology because I guess that’s what I mainly took pictures of.

2-6: The swipe feature that lets you see one data set underneath another was actually really cool. I wouldn’t have thought of that being a thing but I think if you were presenting this map as a project it would make the audience more engaged.

2-7: Screenshot (16).pngYet another symbology screenshot. I guess you can say my main takeaway from these tutorials is that I like colors and symbols a lot. Did I really not take pictures of anything else?

2-8: Screenshot (17).pngI had some issues with the labeling on this one I think. I couldn’t get the labeling to only go on the West Village bookmark like the book asked. Not sure what I could’ve done wrong other than I must’ve missed something small.

3-1: Screenshot (18).pngCouldn’t find the “click text, expand position, and for height, type .45” that the book said to do, so I instead made the Offset Y .45 instead because it seemed close enough to me and thats what I could think of. Also manually moved the text box to look like the one in the book. I think for this one I was just not thinking hard enough. I did search forever for that height section though.

3-2: Screenshot (20).pngHere is the completed version of this map, with the correct information in the popup (because for some reason throughout these chapters that didn’t happen for me all the time). Right as I had kind of figured out the software, we switched to the website, which was way different and interesting to try to understand.

3-3: Screenshot (21).pngCreating a story was very different from what I was originally expecting my coursework to be like in this class. I think the style of the story is sleek and interesting and makes showing your information more engaging. I can absolutely see this being used for a multitude of things.

3-4: Couldn’t seem to figure out how to do the “Adjust your dashboard” section. Dragging the map and docking it weren’t coming up as options for me for some reason. The rest of 3-4 I was able to do. The idea of a dashboard to show information is interesting, I liked all the ways you can customize one.

Overall, the work this week was different from what I expected by the preliminary readings, and took longer than I anticipated. I also struggled to get the software up and running at the beginning, as I had to do a software update and click around to have the beginning map show on my screen, because it didn’t for some reason. There’s a lot more tutorials for next week, so I’m already setting aside more time than this week to work on everything.

Schtucka week 4

1.1 – I was intimidated at first having to put my reading into practice, but the book makes it so easy. I love how it talks you through it and understands that it is the reader’s first time using the software.

1.2 – I don’t like how we learned about pop-up windows here but then didn’t use them again until chapter 3. 

1.3- Using the attribute table confused me at first, but after working with it a few times and some trial and error I think I have it down. I will keep this section in mind though as a reference for when I have to use one next

1.4- For some reason, I could not get the 3D version of the Population Density to work. I restarted and tried multiple times and was not able to get it.

2.1 – Learning how to use a symbol was so much easier than I thought it would be. 

2.2- I found this section relatively easy. It was a lot of repeating the same process over and over. It is useful to know how to turn off repeating labels.

2.3- One section in this tutorial wanted me to make ManhattanStreets a ground feature and I wasn’t sure how to do that so I skipped that step. 

2.4- Creating a 3D choropleth map was the highlight of this assignment. It took me a few tries to get it right, but it was so rewarding in the end. 

2.5- I really enjoyed reading about graduated sizes in Mitchell, so getting to do them was really cool. A repeating trend in this book is everything actually being a lot simpler than I thought it would be. 

2.6 – This section was a little confusing for me. It felt like I was just doing what the book said but didn’t actually understand it. I’ll have to go back and read about it more and do some individual research.

2.7- Reading about dot density maps they seemed more complex than actually making them. I also found it interesting changing the dot value around and playing with the features. 

2.8- I think it is really useful that you are able to change what features show when you zoom. I had a lot of fun making this section.

3.1- While creating my map titles I had a had time figuring out number 6 in the Insert Text section. It says to Click Text, expand Position, and for Height, type 0.45. However, my Position did not have height, but there was a size section that I found height in and use that, however, it did not look like the example.

3.2 – It was a good change of pace to go to ArcGIS online after working in ArcGIS Pro itself for so long. ArcGIS online is equally as easy to navigate as the ArcGIS Pro software, and I like how the online version mirrors the functions and wording as the software. 

3.3 – I felt like this section was very repetitive. I would have liked just reading about creating the website instead of actually copying and pasting what they wanted me to. 

3.4 – I really liked this section! I thought it was really interesting to build my own dashboard and be able to customize it with what I think is the most important and make it how I want to look visually.

Benes, Week 4

Chapter 1: 

  • 1.1 — Easy to follow once the website was up and running. I am not too technological but found that this wasn’t too difficult to understand with some help from peers.
  • 1.2– The attributes were hard for me to understand at first but once I got a handle it was simpler. I really liked being able to see the variations that can happen in GIS
  • 1.3– This was really cool to see the data and numerical values that the data has. I really liked being able to see the data and pinpoint where the information came from.
  • 1.4– Couldn’t see the 3D map version and don’t know why. Might be that it needs to be updated. I am unsure of how to do that.

Chapter 2: 

  • 2.1– I really liked going through the changing of the colors. I did end up with a slightly different looking map than the book has. I am not sure what I did wrong because I went through the same steps.
  • 2.2– I really like how we are working with the labeling part because in the previous section I still wasn’t sure if I was doing it right. Therefore this made me feel more confident in my abilities.
  • 2.3– Changing the symbols and colors wasn’t as difficult as I thought it would be. I am really beginning to understand the various methods to all the programing.
  • 2.4– I began to struggle on page 45. And couldn’t move the tabs in the contents area. I didn’t know how to complete the rest of the exercise for this tutorial.
  • 2.5– This one was short but I got stuck and couldn’t find the template symbol to change the squares to circles. Therefore I did it manually but then they disappeared from the map and I couldn’t get them the same color.
  • 2.6– This was really cool to see the importing of data and to see various ways of navigating through the map.
  • 2.7– I really liked changing the symbols and the corresponding titles. I feel like I am starting to grasp the program.
  • 2.8– This was really cool to see the zooming in and out and how that can change what you can and cannot see.

Chapter 3: 

  • 3.1– I struggled with this section. I couldn’t find the resizing and placing of the maps. I was able to create it but couldn’t find the areas for elements and properties. I couldn’t figure out how to move the map once I placed the ruler guides. I struggled with this tutorial and couldn’t fully complete it.
  • 3.2– This was really cool to see the map on my computer and how it was able to be transferred onto the web version. I however couldn’t get the styles portion completed. It wouldn’t show up for me. I had a hard time working from the web version. I couldn’t find what I needed. 
  • 3.3– It was cool to see more of the arcgis web version. I believe I did the posting and creation of the app correctly.
  • 3.4– This was pretty straightforward. I did struggle with the pop-ups and therefore they don’t show up on the online version. Once it hit the adding of elements I lost some of the data and didn’t know how to continue.

Miller Week 3

Chapter 4:

This chapter discusses what mapping density is and how it can be used for GIS work. I honestly have never thought about this kind of mapping, but it does relate to some important concepts such as population and urban densities. After the chapter defines mapping density and its importance, the chapter talks about how you figure out what to map for mapping density. You can either use point or line methods for this, which is related back to Chapter 3. In general, there are two ways to map density. The first way is to map it by defined areas, which correlates to dividing the total number of features to the area given, which gives the density of each defined area. The second way is through density surface. This method seems more complicated for me to understand, but it does seem like it shows more information compared to the defined areas method. The chapter then dives further into using both methods, and how to undergo both methods using GIS. For the density of the defined areas, one method besides calculating a density value, you can use a dot density map for the defined areas. This allows more accurate representation of where the density is taking place in the given areas. To undergo the second method, the first thing to do is to calculate the density values that you would use. To do this, you need to know factors such as cell size, search radius, the calculation method, and the units that you are willing to use. Overall, these steps seem quite confusing for me, as the process seems more complicated for the density surface. Once the data is presented on the map, then you need to figure out how to present the given data. It is important to know things such as what colors to use to represent the density, along with using the proper contours. 

Chapter 5:

When I first started to read the chapter, I honestly had no idea what “finding what’s inside” actually meant. From what I have interpreted, this chapter focuses on helping pinpoint or to highlight certain features found within a given area of a map. This allows those to see more detail on what is going on in a specific area of interest. When undergoing this process, you need to define the actual area you want to focus on. This area does not have to be a single region, as it can pinpoint other surrounding areas as well. You also want to figure out if the area is either discrete or continuous, which relates to other ideas discussed in the first two chapters. The next question that needs to be addressed is the kind of information that you are trying to collect. It is also important to note that all the features that are being measured within the given areas can also be found outside the given area being measured as well. Overall, there are three ways to make these areas inside. The first method is drawing areas and features, which seems to be a quick and easy method, but it does not provide precise measurements in the areas. The second method is selecting the features inside the area, which gives good insight into one area, but only that one selected area. The final method is overlying the areas and features, which gives the most accurate and precise representation of the data, but is the most complicated process. The chapter then goes on to explain which method one should choose and the process of completing the method of choice. All these methods seem complicated and require multiple steps to complete in my opinion.

Chapter 6:

The start of this chapter seems quite similar to what chapter 5 had to entail. However, what makes this chapter different is that it allows one to define a set distance or feature, which allows one to see what occurs within that area. From what I understand, this allows us to predict how adding something to an area will affect that area, whereas chapter 5 looks at what is already defined in a given area. The first step to this process is to determine the distance of a given area. Then, you need to figure out what kind of information that you want to collect. Usually, this either involves gathering a count, list, or a statistical summary. Another important idea to consider is the amount of ranges that you need, as there can be multiple given ranges within a map. Once those steps are complete, there are three methods to undergo finding what’s nearby. The first method is straight-line distance, which measures distance and is quick and easy to use, but it only gives a rough estimate of the distance. The second method is distance/cost over a network, which can measure either and is more precise, but it requires an accurate network layer. The third method is cost over a surface, which measures cost which allows one to combine multiple layers, but it requires data from multiple sources. The chapter then goes on to explain what method to use and how to use the said method through GIS. Like the previous chapter, the steps to undergo any of these methods seem quite complex. However, I feel like using this book as a guide when it comes to actual GIS work will not be a bad idea, as this book does contain useful introductory information.

Gassert, week 3

Ch. 4

     This chapter begins with map density and what it depicts. In simple terms, map density shows where high concentrations of a certain subject are. Paying attention to map density can help in observing patterns within an area to determine places of interest. Map density can also be shown in two different ways, being by area or density surface. The density by area maps are personally a little easier to understand. More dots or marks in a section of the map means there is a higher density of a certain feature there. Surface density doesn’t show much area separation, making it harder to work with to a degree (but it’s more accurate). With surface density, the GIS will determine the surface density for you, but the user has to determine the cell size. You have to be careful when determining the cell size because if it’s too big, the map may appear vague and unclear. Smaller cell sizes tend to have more detail, which in turn takes up a lot of storage space and may take longer to generate every detail. The textbook guides you through how to calculate an appropriate cell size based on the map size. 


Ch. 5

     Chapter 5 starts with explaining why it’s important to map things in the first place. Many different groups of people can utilize these maps for things like research and political demographics. For example, researchers tracking whale migration would want to see where individuals frequent for breedings and feeding, so marking these places and movements on a map proves to be useful to see where the whales prefer to be for certain reasons. It’s very important to label and define what’s inside the map so you don’t lose track of your data. The book gives a few different ways of finding and keeping track of features in the map, which consists of; drawing areas, selection inside an area, and overlaying areas. Drawing area only gives you a visual of where things are, but does not give you detailed information about what you’ve found. Selection allows you to actually specify the features in front of you. The GIS will search the area map for you and determine the feature and mark it. Overlaying will assign a code to a certain feature that’s in the area. The GIS will check the area for the specific feature and give the features IDs. Overlaying seems to be the most detailed and informative way of keeping track of features on your map. 


Ch. 6

     This last chapter gives reasons for why it’s significant to “map what’s nearby”. The three big methods the book gives for this is cost over surface, straight-line distance, and distance/cost over network. The straight-line distance is the simplest method of determining nearby features. This only measures the distance and roughly estimates the time it would take to reach a location. We use things like this a lot when we go places that are unfamiliar and need to know how to get there and the best (possibly shortest) route to get there. The cost over surface method allows us to determine the cost of travel to a destination. This requires more data to determine the cost involved, but the calculations prove to be pretty reliable. The last method is cost/distance over the network. This method combines the previous two, needing locations of interest along with the value/cost of an area. The last chunk of this chapter tells you how to calculate the cost (time, money, etc.) over a geographic surface. Once you add all of the layers to the map, the GIS thankfully calculates the total costs for you. Once that’s been done, the map user can filter through the cells of the map to pick out areas of higher or lower cost. 

Brock Week 3

Chapter 4:

  • Why map density

Mapping density shows you where the highest concentrations of features are. These maps are useful for looking at patterns rather than locations of individual features and for mapping areas of different sizes. Density maps let you measure the number of features using a uniform areal unit so you can clearly see the distribution. This is especially useful when mapping areas which vary greatly in size (census tracts or counties).

  • Deciding what to map

 Although you can simply map feature locations to see where they are concentrated, creating a density map gives you a measurement of density per area, so you can more accurately compare areas, or know certain areas  meet your criteria. You can create a density map area on features summarized by defined area or by creating a density surface

  • Two ways of mapping density 

You can use a dot map to represent the density of individual locations summarized by defined areas. Each dot represents a specified number of features. The dots are distributed randomly within each area; they don’t represent actual features in that area. Dot density maps show density graphically rather than showing density value. You can use dot map to show density when you have many clustered features. A density surface is usually created in the GIS as a raster layer. Each cell in the layer gets a density value, such as number of businesses per square mile, based on the number of features within a radius of the cell. This approach provides the most detailed information but requires more effort

  • Mapping density for defined areas

With this method, you calculate density based on the areal extent of each polygon. First, add a new field to the features data table to hold the density value. Then, adding the density values by dividing the value you’re mapping by the areas of the polygon. If the density units are different from the area units, you’ll need to use a conversion factor in the calculation to change the area units to the density units. Density by defined area is usually displayed as a shaded map, using a range of color shades with one or two hues. In this case density is treated as a ration and is mapped like any other ratio map. Some softwares lets you calculate density on the fly by specifying the value you’re mapping density for and the attribute containing the area of each feature. The GIS then calculates the density and shades accordingly. Density value for each polygon applies to the entire polygon. The actual density at any given location within the polygon may vary greatly from this value. This is especially true for large polygons

  • Creating a density surface

The GIS calculates a density value for each cell in the layer. Density surfaces are food for showing where pint or line features are concentrated. The GIS defines a neighborhood around each cell center. It then totals the number of features that fall within that neighborhood and decides that number by the area of the neighborhood. That value is assigned to the cell, the GIS moves on to the next cell and does the same thing. This creates a running average of features per area, resulting in a smoothed surface. 

Chapter 5:

  • Why map what’s inside

People map what’s inside an area to monitor what’s occurring inside it or to compare several areas baked on what’s inside each. This allows for people to discern whether they should take action. Summarizing what’s inside each of several areas lets people compare areas to see where there’s more and less of something.

  • Defining you analysis

To find what’s inside, you can draw an area boundary on top of the features, use an area boundary to select the features inside and list or summarize them, or combine the area boundary and features to create summary data. You need to consider how many areas you have, and what type of features are inside the areas. 

  • Three ways of finding what’s inside

Finding what’s in a single area: finding what’s inside a single area lets you monitor activity or summarize information about the area. Multiple areas: finding how much of something is inside each of several areas lets you compare the areas. discrete features are unique, identifiable features. You can list or count them, or summarize a numeric attribute associated with them such as locations, linear features, or discrete areas.

  • Drawing areas and features 

Drawing areas and features: Good for finding out whether features are inside or outside an area. Locations, lines, areas, surfaces. Trade Offs: Quick and easy but visual only so you can’t get information about features inside. Selecting the features inside the area: Good for getting a list or summary of features inside an area. Locations, lines, areas. Trade Offs: good for getting info about what’s inside a single area, but does not tell you what’s in each of several areas (only all areas together). Overlaying the areas and features: Good for finding out which features are inside which areas, and summarizing how many or how much by area. Locations, lines, areas, surfaces. Trade Offs: good for finding and displaying what’s within each of several areas, but requires more processing 

  • Selecting features inside an area

With this method you specify the features and the area. GIS checks if each feature is inside the area and flags ones that are. You can also use this method to find what’s inside a set of areas you are treating as one. However, the GIS doesn’t distinguish which area each feature is in, only that it’s in one of them. Geographic isolation is also a quick way to find out which features are within a given distance of another feature. 

  • Overlaying areas and features

Overlaying areas with discrete features: GIS tags each feature with a code for the area it falls within and assigns the areas attributes to each feature. GIS checks to see which area each feature is in and assigns the areas ID and attributes to the features recorded in the data table. Overlaying areas with continuous categories or classes: GIS summarizes the amount of each category or class features falling inside one or more areas. You can get a map, table or chart of the results. GIS uses either a vector or a raster method to overlay areas with continuous categories or classes. Overlaying areas with continuous values GIS can summarize the values and create a map or table of summary statistics for each area. These include mean, minimum value, maximum value, value range, standard deviation, and sum. You can create a chart from the table to compare areas based on a particular statistic.

Chapter 6:

  • Why map what’s nearby

Using GIS, you can ding out what’s occurring within a set distance of a feature.

Traveling range is measured using distance, time, or cost. Knowing what’s within traveling range can help delineate areas that are suitable.

  • Defining your analysis

Defining your analysis: to find what’s nearby, you can measure straight-line distance, measure distance or cost over a network, or measure cost over a surface. Defining and measuring near: what’s nearby can be based on a set distance you specify, or on travel to or from a feature. When a surrounding feature is within a feature’s area of influence, measure using straight line distance. When movement or travel between the source and the surrounding features happen, measure over a geometric network. Distance is one way of defining or measuring how close something is, but nearness doesn’t have to be measured using distance. You can use cost to measure distance (i.e. travel costs). If you’re mapping what’s nearby based on travel, you can use distance or cost. Costs give a more precise measure of what’s nearby than distance but depending on the situation, distance can be more sufficient. Planar method: some analyses calculate distance assuming the surface of the earth is flat. Appropriate for small areas; city, country, or state. Geodesic method: some analyses calculate distance taking into account the curvature of the earth. Appropriate for large regions; continents, entire earth. List; an example of a list is the parcel ID and address of each lot within 200 ft of a road repair project. Count: a total or count by category. For example, the total number of calls to 911 within a mile of a fire station over a six-month period, or number of calls by type. Summary statistic examples: total amount, such as the number of acres of land within a stream buffer. Amount by category, such as the number of acres of each land cover type within a stream buffer. Statistical summary such as an average, minimum, maximum, or standard deviation

You can specify a single range or several ranges using inclusive rings or distinct bands. Inclusive rings are useful for finding out how the total amount increases as distance increases. Distinct bands are useful if you want to compare distance to other characteristics. 

  • Three ways of finding what’s nearby

Straight line distance, you specify the source feature and the distance and the GIS finds the area or the surrounding features within the distance. This is good for creating a boundary or selecting features at a set distance around a source. You need a layer containing the source feature and a layer containing the surrounding features. Use straight line distance if you’re defining an area of influence or want a quick estimate of travel range. Distance or cost over a network, you specify the source locations and a distance or travel cost along each linear feature. The GIS finds segments of the network are within the distance or cost. You can then use the area covered by these segments to find the surrounding features near each source. This is good for finding what’s within a travel distance or cost of a location, over a fixed network. You need the locations of the source features, a network layer, and a layer containing the surrounding features. Use cost or distance over a network if you’re measuring travel over a fixed infrastructure to or from a source. Cost over a surface: you can specify the location of the source features and a travel cost. The GIS creates a new layer showing the travel cost from each source feature. This approach is good for calculating overland travel costs. You need a layer containing the source features and a raster layer representing the cost surface. Use Cost over a surface if you’re measuring overland travel

  • using straight line distance 

Using straight line distance: create a buffer to design a boundary and find what’s inside it. Select features to find features within a given distance. Calculate feature-to-feature distance to find and assign distance to locations near a source. Create a distance surface to calculate continuous distance from a source. Creating a buffer: to create a buffer, you specify the source feature and the buffer distance. For locations, the GIS draws a circle of a radius equal to the distance you specified. For linear features, the GIS draws a line around the features at the specified distance. For areas, the GIS draws a line around the feature at the specified distance. For areas, the GIS draws a line at the specified distance from the boundary- rather than the center of the area. Finding features within several distance ranges: If you want to know which features are within several distance ranges of the sources as inclusive rings, you have to create several separate buffers and select the surrounding features for each. 

  • Measuring distance or cost over a network

Measuring distance or cost over a network: GIS identifies all the lines in a network, within a given distance, time, or cost of a source location. Source locations in networks are often termed centers because they usually represent centers that people, goods, or services travel to or from where you can then find the surrounding features along, or within, the area covered by those lines. Specifying the network layer. A geometric network is composed of edges (lines), junctions, and turns. Turns are used to specify the cost to travel through a junction. To get accurate results, make sure: edges are in the right place, use edges that actually exist, edges connect to other segments accurately, and use the correct attributes for each edge. Setting travel parameters: In addition to specifying the cost for individual segments, you can specify the cost for turns from one segment onto another or for stops at an intersection.

  • Calculating cost over a geographic surface

Calculating cost over a geographic surface: Calculating cost over a surface lets you find out what’s nearby when traveling overland. With this method, the GIS creates a raster layer in which the value of each cell is the total travel cost from the nearest source cell. Calculating cost over a surface also shows you the rate of change. Specifying the cost: Cost can include time, money, or some other cost. To calculate cost over a surface, you specify the layer containing the source feature and a second layer containing the cost value of each cell. To create a cost layer based on several factors, you combine all the input layers. Getting the information: Once the GIS has created the cost distance layer, you can either identify the area within a specific distance of the source features or summarize how much of something is within the distance. If you’re mapping discrete features with the cost distance surface, you can show them on top of the distance grid. The distance grid is displayed using graduated color

Tuttle Week 3

CH4

Chapter four covers mapping density. “Mapping density lets you see the patterns of where things are concentrated. This helps you find areas that require action or meet your criteria or monitor changing conditions.” Mapping density is to highlight patterns more than the individual features that might be better represented in a different type of map. Mapping density is best represented using shades of colors to represent different ranges of data. The data available will determine what the map might look like. There are two ways to map density: by defined area or by density surface. A defined area can be shown using a dot map and the places with a higher density of dots represent the higher density of features on the map. Defined area map density would also be used if we were interested in how much of a feature is sequestered to a certain area. We might see this map type divided by state, county, country, or any other predetermined separation. The density surface is created in the GIS and shows the density without the predetermined separations. This map does require more work but is more accurate. GIS will calculate the density surface for you. You can determine what the cell size will be. If a cell is too large the map might be too vague, but a cell too small makes the map convoluted and hard to digest. A cell too small also takes a lot of time to process and can take up a lot of storage on the computer/external hard drive. The book gives a detailed description of how to calculate the proper cell size based on how much space is being shown on a map. A map that covers 1 sq. km would have a cell size of 100m. The search radius depends on what the goal of the map is. A search radius too small might not have enough significant features, but a search radius too large can lead to the map becoming too generalized. These types of maps allow the researchers to get a good picture, but it might not be the whole picture.

CH5

People map certain features on a map to determine what is inside the area. Politicians, police officers, and even business owners use these maps to decide whether or not to take action. If a business owner sees that in one area in a city, there are other businesses nearby that are doing well, they are more likely to try and open a branch in that general area. It’s necessary to determine how you will split your data into a single or multiple areas. A single area might be useful to determine if a hotspot is occurring. Multiple areas allow you to compare each and determine if there is a common theme spread amongst them. These areas might be zip codes or state parks. Defining each area and comparing it will give researchers the ability to identify interesting patterns within the maps. You can determine the type of map you need by identifying whether the individual feature is continuous or discrete. The book identifies three ways of finding what is inside the map. Drawing areas and features allows the researcher to highlight what features are inside and outside the boundaries. This is the quickest way to map, but it is strictly visual. Selecting the features inside an area can show the reader information about a single area but does not go deep enough to show several areas. Overlaying the areas and features is the most time-consuming method, however it is also the most detailed. This way finds features inside the areas. This does take the longest, but if a detailed map is what’s most important this is the map in question. Drawing areas can be difficult to decide on a map. A map either has discrete or continuous areas. Discrete areas are often quantitive data like types of injury or crimes in an area. Continuous areas might be more fluid like elevation, population, or even businesses in a specific area.

CH6

Chapter 6 tries to answer the question, “why map what’s nearby?” Traveling range can be determined not only by distance, but also by time, cost, or other factors. The three main ways of finding what’s nearby are straight-line distance, distance or cost over a network, and cost over a surface. Straight line distance is the most simple way for the GIS analysis to work. This type can only measure distance and provides only a rough estimate of the time that it would take a person to get to that destination. This might be used to determine the radius of a school or police station. A cost over a surface allows the researcher to combine different layers of features to determine the travel cost. This type specifically measures cost. It does require a lot more data than the previous type, but the calculation over a range is relatively reliable. The third type is distance or cost over a network. This type is a hybrid of the two previously mentioned methods. This method needs both locations of source features and information about the length or cost value of a particular area. This is the most precise method because it combines both travel distance and cost, but it requires a very accurate network layer that might be difficult to obtain. Calculating costs in GIS can be confusing. The last section of the book goes over how to calculate cost over a geographic surface. Cost can mean time, money, or other factors. Cost layers in GIS can be based on a single factor or using several. Once you have inputted all of the layers, GIS will combine them to determine the total cost. Each cell is given a cost and based on the type of map assigned a color or shade to represent the cost. Once GIS has determined the cost of each cell the researcher can manipulate the map to exclude costs, either too high or too low, and even exclude entire sections due to geographic concerns. The maps that GIS can make are so highly specialized that with the right data GIS can make whatever map the researcher wants.