This week, I explored the Delaware County GIS Data Hub and reviewed the available datasets. Below is a brief description of each dataset and how it can be used.
- Parcel: Shows individual property boundaries throughout Delaware County using polygons. Useful for identifying land ownership, property sizes, and land records.
- Street Centerline: Represents the center of public and private roads. This data can support navigation, emergency response, and transportation planning.
- Condo: Shows the locations and boundaries of condominiums recorded in Delaware County.
- Subdivision: Contains information about subdivisions and condominium developments throughout the county.
- Address Point: Identifies the geographic location of individual addresses. Particularly useful for emergency services and accurate property location.
- Zip Code: Displays ZIP code boundaries across Delaware County.
- School District: Shows the boundaries of different school districts, which can be useful when looking at residential locations.
- Building Outline (2021, 2023, 2024): Shows building outlines across the county for different years. Comparing these datasets could help identify changes in development over time.
- PLSS: The Public Land Survey System represents land survey boundaries within the US Military and Virginia Military Survey Districts.
- Township: Displays the boundaries of the 19 townships in Delaware County.
- Original Township: Shows the original township boundaries before changes associated with tax districts.
- Municipality: Identifies the boundaries of cities and villages within the county.
- MSAG: The Master Street Address Guide represents political jurisdictions used for address identification and emergency response.
- Recorded Document: Contains locations associated with recorded land documents, including surveys, annexations, and other property records.
- Dedicated ROW: Shows designated rights-of-way, which are important for road access and infrastructure management.
- Precincts: Displays voting precinct boundaries throughout Delaware County.
- Delaware County Contours: Represents elevation changes using two-foot contour intervals. Useful for understanding terrain and drainage patterns.
- Map Sheet: Shows the geographic divisions used to organize county tax maps.
- Farm Lot: Identifies farm lot boundaries within the historical military survey districts.
- Annexation: Shows areas annexed into municipalities over time, dating back to 1853.
- Survey: Contains points representing recorded land surveys throughout the county.
- Tax District: Displays boundaries of areas used for property taxation.
- Hydrology: Represents major waterways, including rivers, streams, and reservoirs in Delaware County.
- GPS: Shows GPS survey monuments established in 1991 and 1997, which serve as geographic reference points.
- Railroads: Maps railroad lines across the county.
- Delaware County E911 Data: Contains geographically accurate address information used for emergency response, geocoding, and disaster management.
- DXF Files: CAD-compatible versions of certain datasets, such as address points, street centerlines, and building outlines, useful for engineering and surveying.
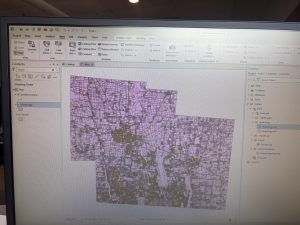
For the mapping portion, I downloaded the Parcel, Street Centerline, and Hydrology shapefiles and added all three layers to a new ArcGIS Pro project. Looking at the combined map, I noticed how much parcel sizes vary across the county. Some areas have many small, closely packed parcels, while others have much larger plots of land. The street centerlines also appear more concentrated in areas with smaller parcels, which makes sense given the greater development in those locations. Adding the Hydrology layer helped me see how waterways fit into the county’s overall layout. It was interesting to see these three datasets together, rather than separately, to better understand land use, development, and infrastructure.