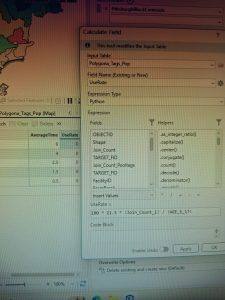
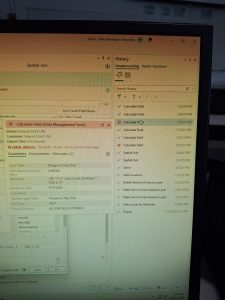
Chapter 7
Chapter 7 had a lot of work to do with the “manual” parts of the program. We still used system tools to do this, but the work to make the features look the way we wanted was done my manually moving them around and creating them. We practiced smoothing shapes, making new features using the satellite map as a template, and how to adjust existing features to better fit a map.
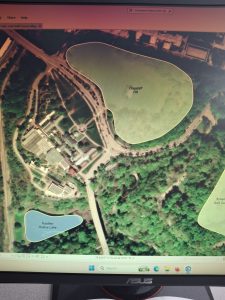
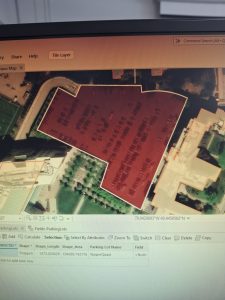
One of the activities in this chapter did not work well for me. We had to move the layout layer of a building to match the layer of the outline, and the tool used to move the corners to match up was very ineffective. This is the feature before and after me moving it into place for a second time.
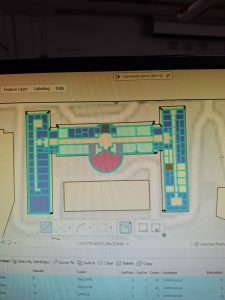
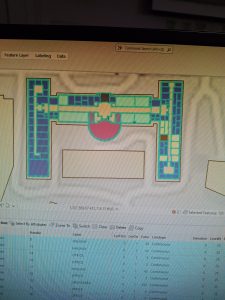
Chapter 8
Chapter 8 explored geocoding and explained how important getting a good score in accuracy is when presenting information. It demonstrated that perfecting data or looking at a more reliable aspect of the data, like zip code, made this score higher. I completely forgot to take pictures of this chapter somehow, but I pretty promise I did it.
Chapter 9
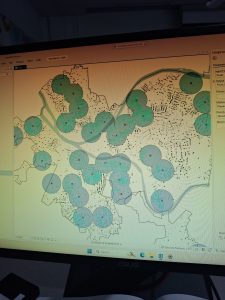
Chapter 9 demonstrated different ways of doing spacial analysis. One thing that I really could not get to work properly was the buffers. The first time we did them, the features in the first buffer would select, but when I tried to select the bigger rings of buffer, they would not select. The second time, when we did not layered rings, none of the features would select, only the middle of the buffer. That example is shown here (after the smaller rings when it did work):
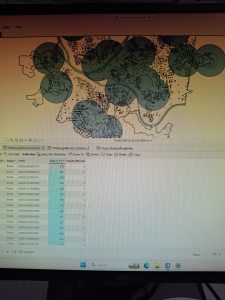
Another specific thing we did in chapter 9 was analyze data with the summarize tool and make a visual graph with it. This also did not work correctly for me. When I clicked on the feature the book asked for, it showed up as a different feature in the code, and I went to fix it, and it gave me an error. I decided that maybe the code it made up was just what it had to be, but that gave me all 0s as values. A peer checked this over and they followed the same process I did, but they did not get weird code or a 0 result. That is shown below as well. My graph was very not right as a result of this, but I did make it just to learn how.