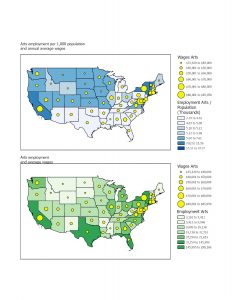
Preface: The preface of this book explains that ArcGIS Online is a service that allows for making, analyzing, and sharing interactive maps. In part one of this book, users learn how to work with existing ArcGIS maps and how to navigate maps and data. Readers also learn how to use cartographic principles to symbolize a range of map types, build map layouts, and use ArcGIS storymaps to present results. Part two introduces the usage of real data to prepare for use. In part 3, the book focuses on analyzing spatial data and maps to solve problems. Buffers, service areas, facility locations, and data clustering will be used to analyze spatial relationships. Raster GIS and ModelBuilder will be used for analyzing demand for services. Lastly, readers use 3D GIS in the context of city planning.
Part One: Using, Making, and Sharing Maps:
Chapter 1:
In this chapter, an existing map is used. It has the locations of urgent health-care clinics in Allegheny county, PA. There are both federally qualified health centers that provide subsidized healthcare, and nonsubsidized clinics. The purpose is to be familiarized with how the software works and to analyze both clinic types to determine if they are sited in appropriate locations.
Terminology:
- Feature class: building block for displaying geographic features. Feature classes are vector data with corresponding attributes for each feature.
- Clinics: line feature. Has centerlines for all streets in the county.
- Municipality: polygon feature class that has boundaries for all municipalities in the county.
- Raster dataset: major type of spatial data. It is an image made up of pixels so small that you cannot see individual ones. If it is encoded with geographic coordinates, it can be used as a layer in a map.
- File geodatabase: folder that stores feature classes, raster datasets, and other data files.
- Project: file that contains maps
Tutorial:
The tutorial was very helpful in learning how to navigate the map. It showed how to:
- Get an overview of ArcGIS Pro
- Set up a project
- Add an d remove basemaps
- Turn layers on and off
- Reorder feature classes in the contents pane
- Examine the catalog pane and open and export a map layout
- Navigate ArcGIS Pro
- Use a popup window
- Zoom in to a raster feature class
- Use bookmarks
- Search for a feature
- Work with attribute data
- Open a table
- Work with fields view of an attribute table
- Select records and features of a map feature class
- Obtain summary statistics using a tool
- Symbolize maps
- Symbolize feature classes
- Label a feature class
- add/remove feature classes
- View and navigate scenes
Overall, I learned a lot in this chapter about how to navigate GIS. So far, it is a very interesting application and seems very user-friendly. I was able to follow all of the instructions provided even though I have never attempted to navigate a map site like this.
Chapter 2:
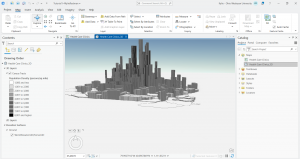
This chapter explains map design, specifically, how to design and symbolize thematic maps. Thematic maps help to solve and investigate problems. Thematic maps are composed of subject layers placed in spatial context of other layers. When deciding on layers for thematic maps, you should consider two things. The first is what layers are required to represent the subject, and the second is deciding on spatial context layers needed to orient users to recognize locations. Vector layers are used for subjects of thematic maps because of a large amount of data. This chapter focuses on cartographic skills and principles on symbology using several vector-based thematic maps.
Tutorial: for this chapter, it shows how to:
- Symbolize qualitative attributes
- Display polygons using a single symbol
- Display polygons using unique value symbols
- Label features and configuring popups
- Change label properties
- Remove duplicate labels
- Manage popups
- Filter with definition queries
- Create a definition query
- Symbolize figure and ground features
- Create choropleth maps for qualitative attributes
- Create a choropleth map of households receiving food stamps
- Extrude a 3D choropleth map
- Display data using graduated and proportional point symbols
- Create a map of graduated size points
- Normalize population maps with custom scales
- Create a choropleth map with normalized population and custom scale
- Import symbology and use swipe to compare features
- Create dot density maps
- Set visibility ranges
- Set visibility range for labels and feature layers
I learned a lot in this chapter about thematic maps and different displays of them. It was very informative on scaling and labeling.
Chapter 3:
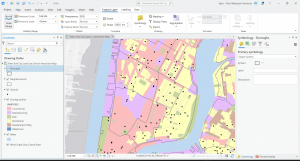
This chapter shows how to share maps with people who do not have skills with maps besides navigation. This chapter teaches how to provide maps in many different formats. Formats include reports, slides, posters, or static maps for websites created from map data, online interactive maps, interactive online purports and presentations, and interactive online dashboards.
Tutorial: this chapter shows how to:
- Build layouts and charts
- Create a layout and add maps to it
- Resize and place maps
- Add guides and snap maps to the guides
- Insert legends
- Insert text
- Create charts
- Share maps online
- Set properties for online sharing
- Share maps in ArcGIS online
- Use map viewer in ArcGIS online
- Change the style of a layer
- Configure pop-ups
- Create a story and a briefing in ArcGIS StoryMaps
- Create a story
- Add blocks for the introduction
- Add a sidecar block with a mao
- Add content for the left panel of the map
- Enable navigation
- Add credits
- Preview and publish map
- Create a briefing
- Create a dashboard in ArcGIS Dashboards
- Create a dashboard and add a map element
- Add a table element
- Adjust table
- Add serial (bar) chart
- Add interactions to the dashboard
- Finish the dashboard
This chapter was very different from the last two chapters as it shows ways to display the information to other people who do not know how to use GIS. The tutorial made it very easy to organize charts and align the graphics in a way that is easy to read.