Chapter 1:
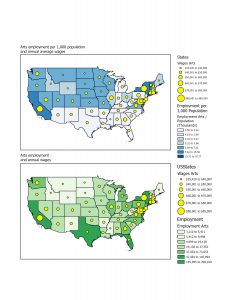
This chapter introduced ArcGIS; it was easy to understand and follow along. The first tutorial in this chapter focused on understanding the software and where everything is. I learned about basemaps, how to turn different layers on and off, and how to reorder features on the map. I’ve learned how to use a pop-up window. When navigating maps, you can use bookmarks to help get there more easily. I wasn’t able to create my own bookmark on my map, but I understand how to. The attribute table has rows and columns of different data. Attributes provide data needed to solve a problem or investigate patterns and allow the user to search for useful information and mapped features. When analyzing, there are tools that can have the GIS create an attribute table based on the type of information you want. In tutorial 3, I created an attribute table of the minimum, maximum, mean, and standard deviation of the population density. Tutorial 4 was about adding a feature class to the map from a geodatabase, symbolizing it, and then removing it from the map.
Chapter 2:
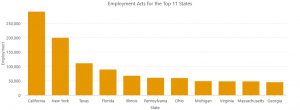
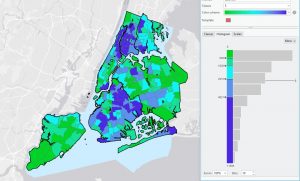
This chapter was all about map design. The chapter had 8 tutorials in total, the first tutorial taught me how to symbolize features by their code. This reminded me of one of the chapters by Mitchell about how it talked about giving certain features a specific symbol. The second tutorial focused on how to label features and how to configure pop ups. This tutorial taught me how to remove duplicate labels from my map, this helped declutter the map and be easier to read. The third tutorial helped sort through the data by creating a definition query, which is a filter with features of a layer. A definition query allows you to display only the features you’re interested in. The fourth tutorial was about creating a choropleth map, a choropleth map that uses color in polygons to represent numeric attribute values. I had a little difficulty creating the 3-d choropleth map. Tutorial six was about how to create your own scale for the data, I found this kind of fun being able to manipulate the groups of the data. Tutorial seven taught me how to create a dot density map, and tutorial eight was about setting visibility ranges. I found this helpful for displaying names of schools or counties within a certain distance to not overwhelm the map.
Chapter 3:
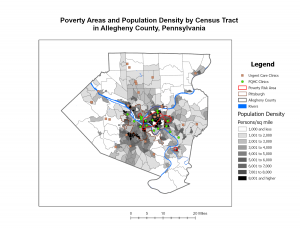
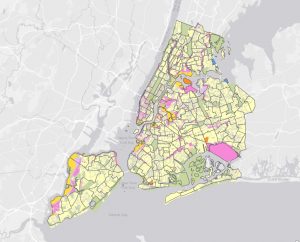
In this chapter the textbook covered ways to display the maps that you create in the GIS software. It also covered how to share the maps online via the arcgis online website. When trying to share my own map to the web, the software wouldn’t load, and never finished uploading. This chapter taught me how to properly align the maps through the guide tool, by making rulers along the page. Some other tools that I learned how to use from this chapter include creating a legend, with/ without a title, and how to create charts. The legend allows the map’s audience to interpret the map’s symbology and understand what the map is portraying. The third tutorial was about how to properly present your graphs in a presentation style though arcgis online. I found this tutorial a bit easier compared to the rest because it was mainly copying and pasting from the word doc. However I do understand when making my own presentation of the data it won’t be that easy because I will have to come up with everything for the text boxes.