
Screenshot
Completed GEOG 291 quiz
My name is Katie McMahon and I am a sophomore this year. I am majoring in Environmental Studies and I am minoring in Sociology. This class is required for my major but I think learning the content will be important for my major.
Before reading the passage by Schuurman, I was unfamiliar with GIS and its importance. I had a vague understanding that it was a collection of data, but after reading the passage, I learned that it is the examination of the map and not just a graph of data. With understanding that, I learned how it contributes to everyday life and not just the environmental aspects of life. From the passage, I learned how much GIS has advanced over time and how these advancements are improving urban life. I found it interesting that so many amities such as parks, buildings, and other public spaces rely on the spacial data from GIS. I also found it interesting that many choices that people make every day are influenced by the systems that GIS created. And with that, the reading pointed how GIS can be related to feminism by questioning the data that was collected for any bias. From the reading, I did learn how GIScientists analyze their data very closely since bias and miscommunication can occur. Along with that the author states how GIScience is the theoretical justification for data and showcases the way in which the data was collected. Whereas GISystems are much more straightforward in presenting the data. From the reading I learned that GIS is more than just a collection of data. It’s more about the interception of the data and what it means. This can prove to be important to the environment and urban living since both influence each other on a daily basis.
GIS data of crime density in
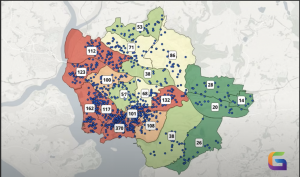
This figure shows crime density in different locations. This can prove to be important for people living in these areas to know where crime occurs and the analyzation of why crime is happening in these places. This is important for safety and then striving to eliminate the cause of the crime.
Shrivastava, A. (2025, May 15). Crime mapping with GIS: Tools, techniques, and real-world uses. GeoWGS84. https://www.geowgs84.com/post/crime-mapping-with-gis-tools-techniques-and-real-world-uses
GIS data of deforestation in the Brazilian Amazon
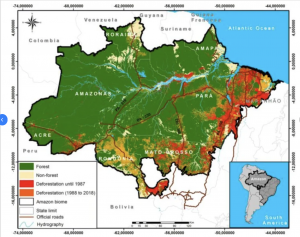
This figure examines the rate of deforestation to the rate in which the forrest is restoring from 1975-2018. Scientists can analyze this rate of restoration compared to deforestation in order to redirect deforestation into a part where restoration is greater than the loss of trees and wildlife.
From Monitoring deforestation using GIS, by Da Cruz et al. (2021), as reproduced in Rahman et al. (2025), ResearchGate. https://www.researchgate.net/figure/Monitoring-deforestation-using-GIS-Da-Cruz-et-al-2021_fig4_388281540