Week 4 Post
Chapter 1:
The first chapter explains the basics of GIS, namely what it is and its potential uses. The chapter explains that point, line, and polygon data is referred to as vector data and that a set of features that are grouped and displayed together are referred to as a layer. Maps are usually composed of multiple layers, which is useful for turning them on and off particular features. When features have corresponding data that relates to them, that information is known as attribute data. Features are great for visual analysis, but when features also contain attribute data the potential for analysis skyrockets. GIS provides many tools that can manipulate, sort, and summarize large data sets for a wide range of uses. The rest of the chapter takes you through exploring ArcGIS online.
Chapter 2:
This chapter covers the basics of 2D and 3D maps in ArcGIS Pro. Skills described include importing a map document, creating folder connections, examining feature attributes, measuring distances, adding base maps, creating bookmarks, and creating a 3D scene. Overall, this chapter lays the groundwork for starting most projects and familiarizing oneself with the general layout of tools in the main ribbon, as well as manipulating layers under the Contents tab.
- Africa
- Go to the View tab and click on the Contents button
- The geoprocessing tools can be accesses by clicking the Tools button on the Analysis tab
- Shanghai has the largest population
- The tallest building is 339.75 ft
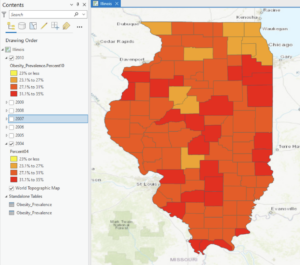
Chapter 3:
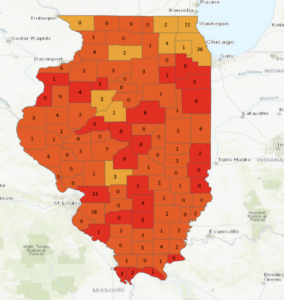
Chapter 3 focuses on geospatial relationships and manipulating data. The first thing you do is practice extracting data from an established dataset. The chapter also instructs how to join data tables and how to calculate summary statistics. I could not get the swipe function tool to work, which was weird. Other problems were mostly due to changes in the interface, so there wasn’t congruency with the instructions.
- State_Name
- 10,575
- There are seven years represented
- There doesn’t seem to be any correlation
- About 26%
- There are 4 food deserts in Knox County
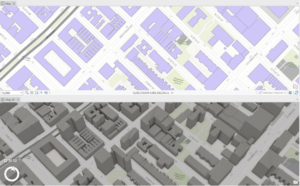
Chapter 4:
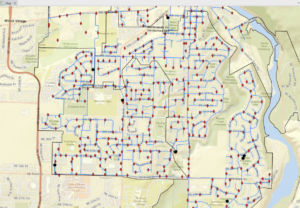
Chapter 4 deals with building a geodatabase so that you can convert shapefiles to feature classes and perform other related functions. I particularly enjoyed manipulating the polygon features by splitting and merging them. Overall, this chapter follows the same format as the others.
- 4
- It automatically updates to show the new area of each of the new zones
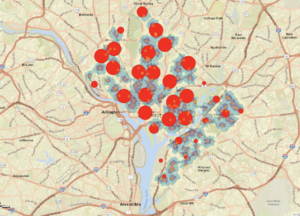
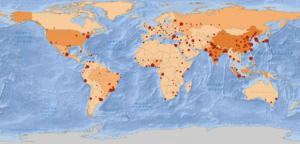
Chapter 5:
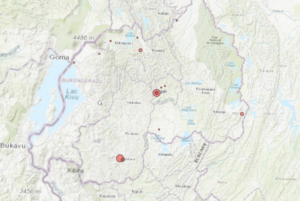
Chapter 5 is a very important chapter because it covers how to streamline work flows or tasks with the use of GIS’s built in model builder and through Python. Python is a tricky coding language, but it works along the same principals of model builder, which is why I really like that they let you play around with model builder first.
- Armed conflicts and acts of violence, generally speaking.
- 14,211
- 71
- There were 41 riots/protests and 12 fatalities
- Select Layer by Attribute and Summary Statistics
- 26,323
(Sorry if my pictures look weird. I had the original screenshots saved in a google doc, but they wouldn’t paste over so I had to rescreenshot them and then upload them.)
All good. Seems like you got through without too many issues. You’ve been through enough different variations on ArcGIS and should be starting to get more comfortable with it.