Here is my work from the chapters this week:
And then the Delaware Data information:
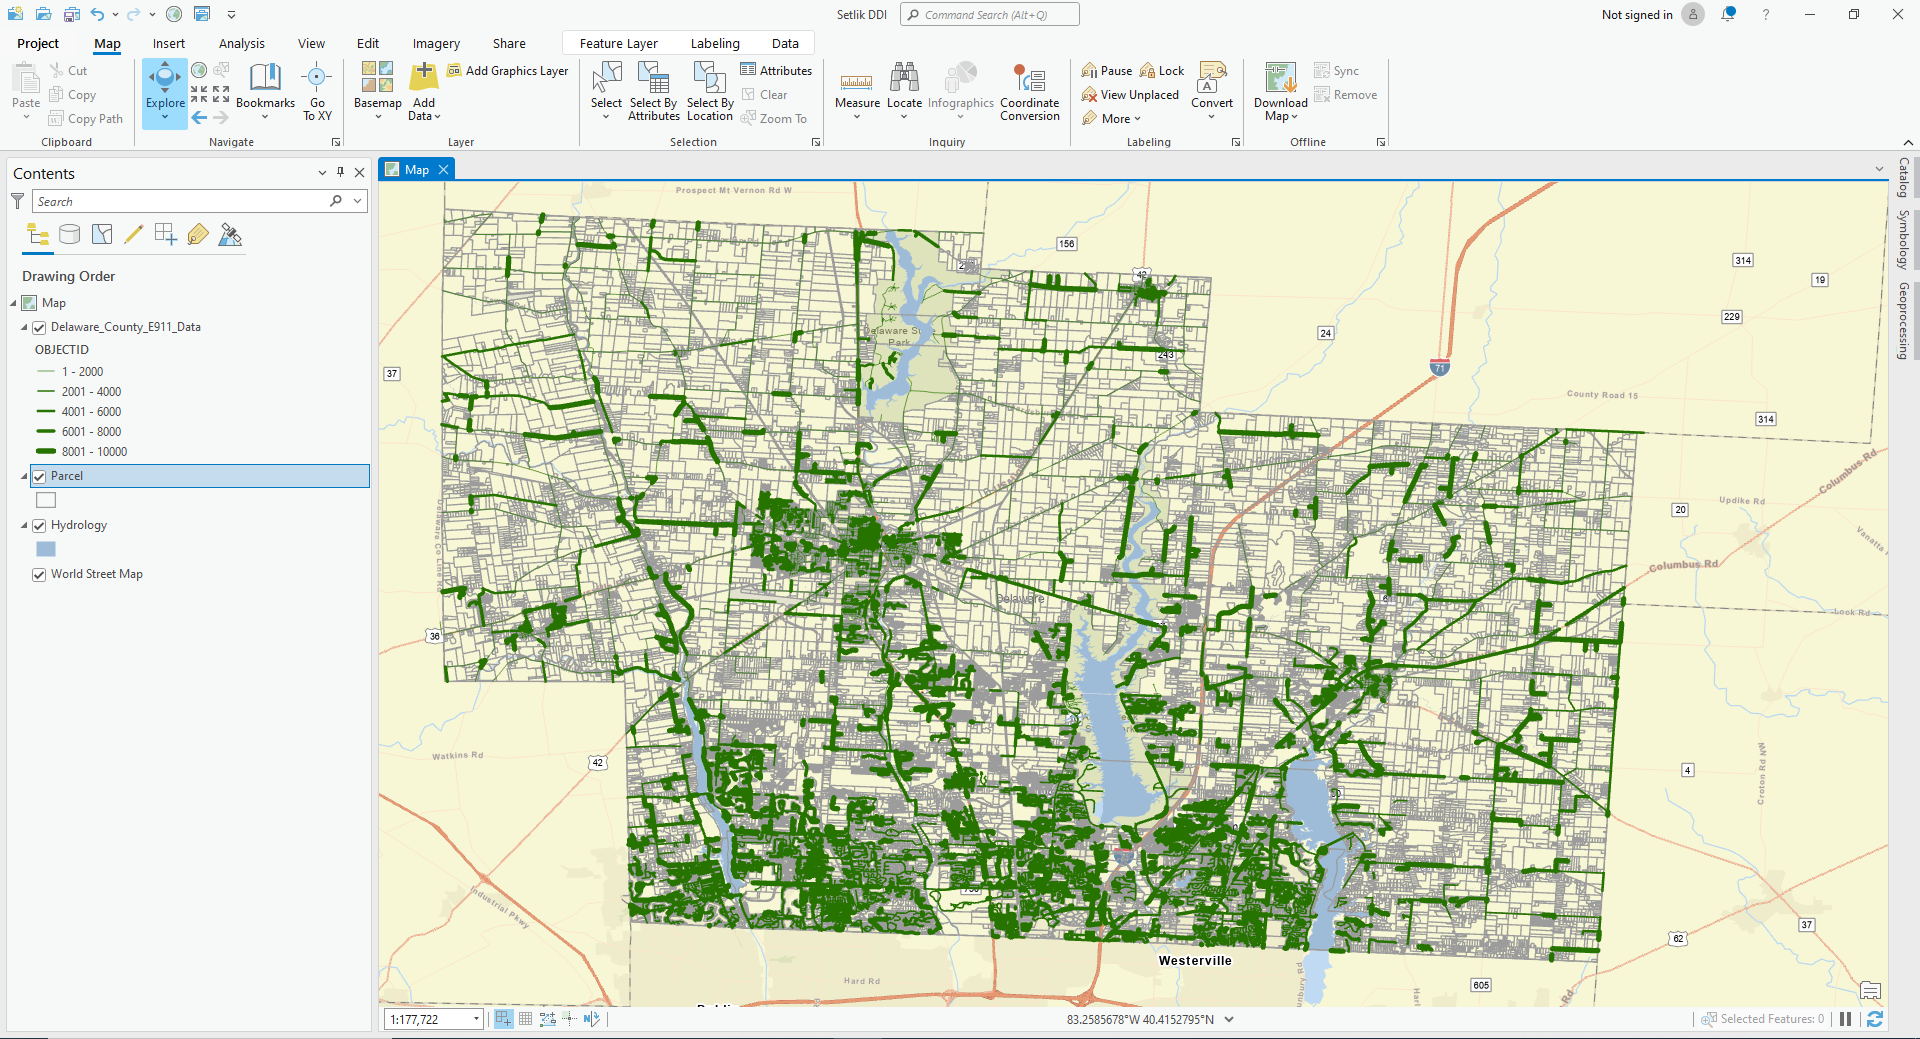
Week 5 – Delaware Data Inventory
On to the final! Good luck everyone
Geography 291: Geospatial Analysis with Desktop GIS
Module 1: 8/26/2026 to 10/16/2026, OWU Environment & Sustainability
Here is my work from the chapters this week:
And then the Delaware Data information:
Week 5 – Delaware Data Inventory
On to the final! Good luck everyone
Chapter 5
Chapter 6
Chapter 7
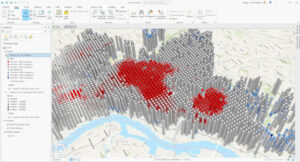
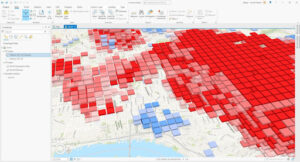
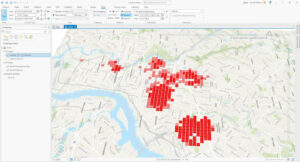
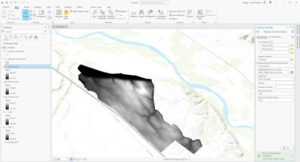
The three time patterns
Three more ways, but for mapping change
Good stuff John.
I did all five parts in record time!
I really enjoyed this final as each part had a different challenge. Some required more thought and more help than others but it was good to learn.
https://sites.owu.edu/geog-191/wp-content/uploads/sites/208/2022/10/SD-GEOG-191-Final.pdf
DATA SUMMARY
Some of these data were self-explanatory, and others required a little more reading.
Definitions:
Chapter 6:
Chapter 7:
Chapter 8:
Chapter 9:
Chapter 10:
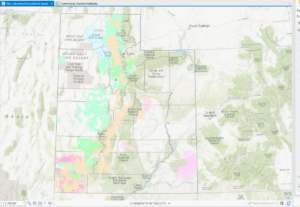
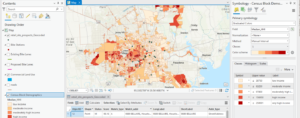
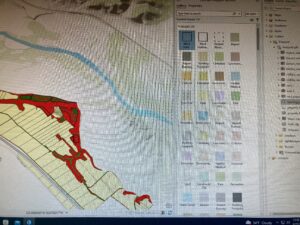
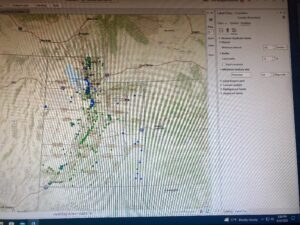
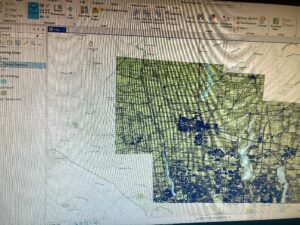
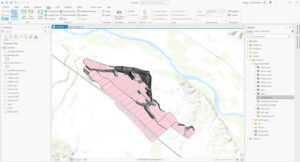
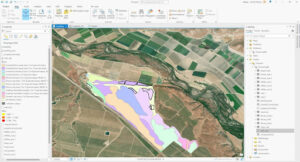
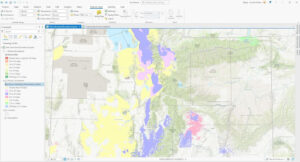
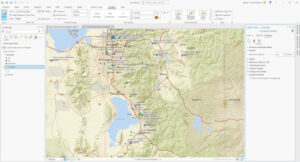
Here is Chapters 6-10 and the Delaware Data Inventory. The second PDF is a series of maps from the chapters (I do not remember which ones they belong to), and the last maps are from the Delaware Data inventory. Tried to put them into a pdf but the files were all more than 20 mg–click on them or they will be blurry…
Chapter 6-10 and Delaware Data Chapter 6-10 and Delaware Data
Chapter 6:
6a
Chapter 7:
7a

7b
7c

Chapter 8
8a

8b
8c
8d
Chapter 9
9a
9b
9c
Chapter 10
10a
10b
10c
10 d