Maglott-Week 6

Chapter 9: 

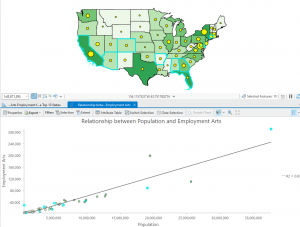
This chapter introduced the Service Area Layer tool, which allowed you to add a network of things together. Overall, I didn’t have too much trouble with this chapter. I had some trouble with 9.3 because I could not add the new fields to create the scatterplot. I’m not really sure if it was an issue on my end or a bug in the tutorial. I also selected sum for the DemandWeight in 9.4 but I didn’t notice anything happening or change. I’m not sure if J was supposed to see a change or not. One thing new this chapter mentions is K-means which is used for clustering. I noticed under the clustering method that there were also k medoids. I’m curious what they could be for.


Chapter 10

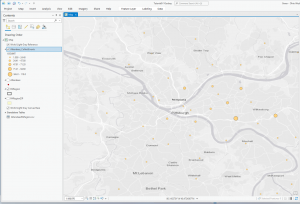
This chapter introduced some new concepts and tools. One was the Kernel Density Smoothing tool which allowed you to smooth data spatially. We also got a chance to use ModelBuilder and build models in ArcGIS Pro. I think this tool could be really helpful if you are creating something for an employer. Additionally, the drop shadow under the process and output boxes symbolizing they have been run is neat. The Validate button can also be used  to ensure they are ready to run again or edit. I ran into a few issues with FHHChld weight and NoHighSchoolWeight. I learned that you have to click save before rerunning the model for there to not be error marks by these parameters. I eventually  got model to work

Chapter 11

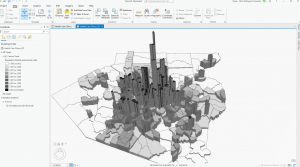
I really enjoyed learning the keyboard shortcuts for moving around the map in this chapter. You can use J for down and U for up, A to go left and D to rotate right ,W and S tilt up and down , and B+move mouse allows you to look around in one spot sort of like a 360 tour video. By selecting Map properties for 3D-> illumination-> date and time, you can see the shadows and 3D features of the map in real time, which I thought was cool. I thought it was cool how we were able to display 3D images on the map like the trees. We also used the Create LAS Dataset tool in 11-4 which made a really cool 3D model of the city. I thought it was cool how we could modify the scale of the building in section 5. This was done by selecting Modify under the edit tab and the clicking scale on the pane that popped up. This would be really helpful if you were trying to design a new building.
My most favorite lesson from this book was section 7 where it goes over how to make a animation with the bookmarks. I thought that this was both really cool and something I could definitely see myself using in the future for an employer project. We were able to make the animation by going to manage bookmarks, then clicking the add button under animations on the view tab. Next, we clicked create first keyframe and then clicked the first bookmark. After selecting the second bookmark we clicked Append Next Keyframe at the bottom to add it to the animation. After repeating this with all the bookmarks, they were strung together into a short clip. You can also make it pause on a scene by clicking the scene and selecting hold. Click insert after moving to a different location on the map to make the animation go to that area.
Bryan Week 6

Chapter 9
9.1- I got a bit confused during the Your Turn part and accidentally overridden the previous buffer, but I was able to fit it.
9.2- This made the last chapter’s “Your turn” seem like a redundant step, as it just taught us how to make multiple buffers.
9.3- The spatial joins failed. I am unsure as to what caused this error as I triple-checked the textbook instructions.
9.4- This one was a bit confusing, not in the steps, but more what I was trying to achieve.
9.5- While I was able to complete the tutorial, I believe I did the “Your Turn” part incorrectly, as my table did not match the book’s. However, I am unsure as to what the mistake was, as I tried to follow the instructions closely.


Chapter 10
10.1- For some reason, LandUse.Phg did not appear in my folder, although I completed all prior steps correctly. I am unsure if this was a personal or computer error.
10.2- Pretty straightforward and easy to follow. However, I wish the book would specify which tool it wants me to use, as there are sometimes different types with the same name.
10.3- The beginning “Your Turn” part confused me, as I felt I wasn’t given enough information to properly build the tool. I’m not sure if this affected the rest of the tutorial, as no helpful pictures of the map were included

Chapter 11
11.1- It was really cool to see the 3D version of the map, and the tutorial was very easy to follow
11.2- This was pretty straightforward
11.3- It was really cool seeing how to add trees to the map
11.4- I noticed that the processing tools in this chapter were really glitchy. They kept overriding my inputs, and I had to repeatedly redo the specific tools. I also received a lot of warnings, and at one point, the tool did not have settings that matched the textbook.
11.5- This one was pretty straightforward, although some of the instructions weren’t very clear.
11.6- The 3D street view did not load after 10 minutes so I decided to move on.
11.7- The animation was pretty intimidating at first, but it turned out to be really easy and super cool to see.

Bechina Week 6

Chapter 9

9.1    I was ready to get started on a clean slate for part 3 so I’m glad this section was straightforward and simple. It was cool that when the buffers overlapped they just joined together. 

9.2    Creating multiple ring buffers was cool and I could see myself using it in a project in the future. Using the spatial join tool to see how many youths had good vs. excellent access was also very cool. Doing it with 3 rings was cool too.     

9.3     This section was a bit more tedious but it was good. It was cool to create the scatterplot.

9.4    I had no problems with this section. The lines looked really cool. It is interesting how many ways you can interpret one data set.


9.5    I liked doing the “Your Turn” part of this tutorial. I wasn’t sure if I knew how to do it but I figured it out as I went on.


Chapter 10

10.1     Changing the transparency of the land use map so that we could see the hillshade with it at the same time was so cool and I definitely see myself using this in the future.

10.2      This section was super easy. There was one part where I got confused: the book said to “run the tool” after symbolizing a layer. That was weird but I just ignored it.

10.3     I had quite a few issues with this section. When I was using the raster calculator, and I clicked on the raster names to add them to the calculation, they wouldn’t fill in so I had to write everything out. I also messed it up the first time so I had to do this a lot and it was very tedious. I also suspect something else went wrong because my poverty image did not look the same as the books. 

Chapter 11

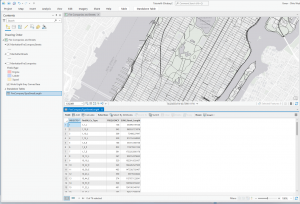
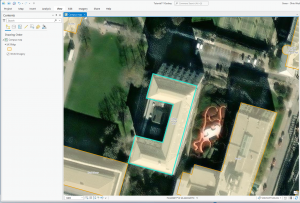
11.1     This part was so cool!!! I feel like it might take a minute to get used to navigating with the keyboard but I feel like I’m already getting it! So fun! Picture from Denver.

11.2    This was another good section. I liked that we took out everything but the AOI. It would get kind of overwhelming with the whole world map. 

11.3   This section was so fun! The trees are so cute.

11.4    I didn’t really have any issues with this section, I’m just not sure I fully understand it. I know that a lot of the work done was to create the building heights, but I didn’t fully understand the process to get there. Creating the line of sight was so cool.

11.5   This tutorial was cool. Extruding the buildings was very simple.

.     


11.6    This section felt like google maps because of all the buildings on smithfield street.

11.7     Creating the video was so cool… I didn’t even know you could do that on ArcGISPro.

Nagel Week 6

Chapter 9

  • 9.1: Very short and straightforward, just learning to use the cluster tool
  • 9.2: Again very straightforward, didn’t have any issue with the spatial overlay.
  • 9.3: This one definitely took a while, at least longer than the others and was definitely more complicated. Did not have any technical issues that other classmates seemed to have experienced though.
  • 9.4: At the very end of analyzing for the optimal situation, using the summarize tool didn’t seem to work. Or at least, no change occurred that I noticed.
  • 9.5: Another straightforward section that just focused on changing symbols and labels.

Chapter 10

  • 10.1: Very interesting to see the 3D landscape overlaid on the 2D map beneath.
  • 10.2: Heat maps are among my favorite types of map… that sounds weird to say now that I think about it, but there is something about them that is inherently interesting so it’s fun to play around with.
  • 10.3: Was ultimately very disappointed in the end result with this part. Took me two hours to find and put everything together from the model to the codes, and on the last step to run the tool I was met with some unknown error so it felt like a waste of time.

Chapter 11

  • 11.1: Basically Google Earth but playing with exaggerated features and time based lighting.
  • 11.2: I mean I suppose it’s interesting to see the different layers in different colors contrasting. All came together at the end seeing the landscape reflected accurately.
  • 11.3: Shows how to add realistic objects to a map using z features and points.
  • 11.4: The drawing of the bridge arch using z points didn’t work, and neither did the line of sight analysis
  • 11.5: Very straightforward. Interesting to play around with the height of objects.
  • 11.6: Was initially concerned since nothing was happening, then the building finally showed after playing with the properties in a different step. Interesting to see a realistic-ish building model.
  • 11.7: I don’t think animation has ever been easier… I joke but its still cool to see an animation which is something like a 3D tour

Hagans Week 6

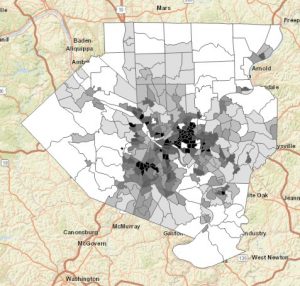
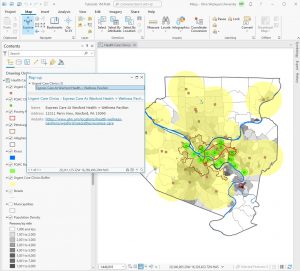
Chapter 9- This chapter went fairly quickly and I did not run into any problems during these tutorials. Overall, this chapter went more in-depth on using buffers to analyze proximity and to find what’s near something. I don’t think we’ve had to use the buffers yet (unless I’m forgetting an earlier tutorial), but I really enjoyed learning how to use them and discovering more about how to analyze what is around certain places and how you can utilize ArcGIS tools to find useful things about the data. Looking ahead to the final exam, I think this chapter will come in handy, as using buffers is one of the options for the final. In the first few tutorials, I learned how to use buffers to calculate the total number of kids near public swimming pools. I think this would be a very useful tool for businesses to ensure that they are in the optimal location for their target demographics. You can also use the buffers to set location parameters as being excellent, good, or poor in proximity to a certain location- which could influence certain policies and encourage new builds. This chapter also went over some more Python concepts, how to create scatterplots to discover linear relationships, and how to use the Multivariate Clustering tool to analyze and interpret cluster data. The chapter used those last few concepts with regard to serious crimes, but I think that this kind of analysis could be used for various other reasons. 

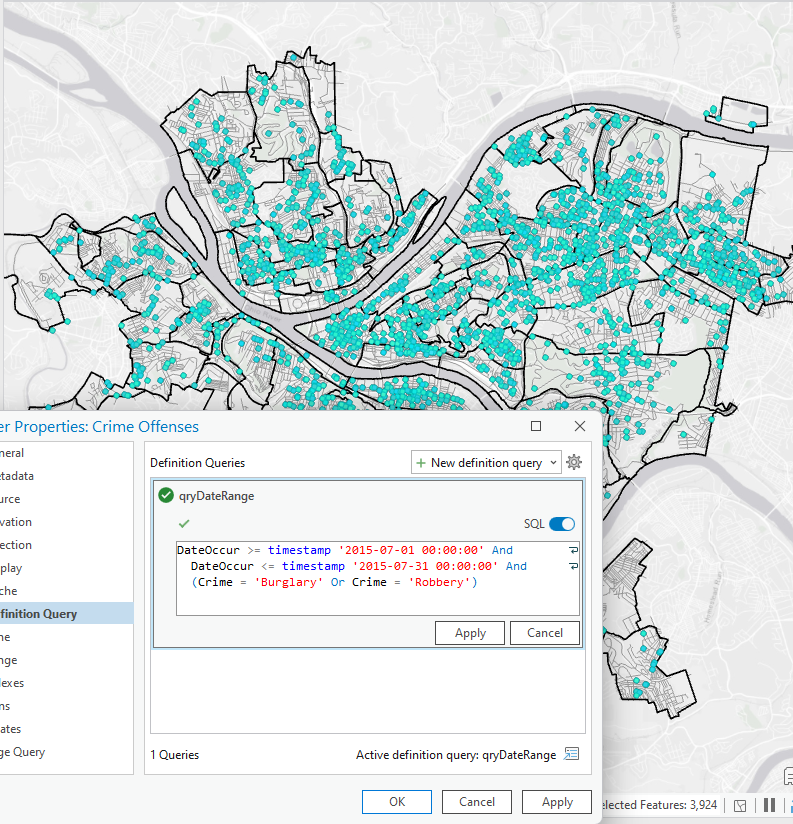
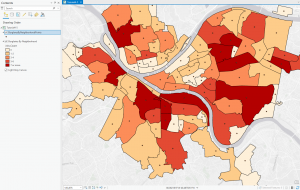
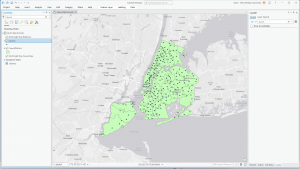
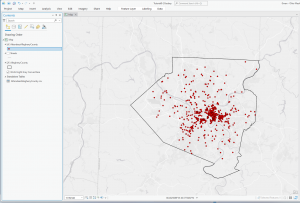
MapCh9Crimes

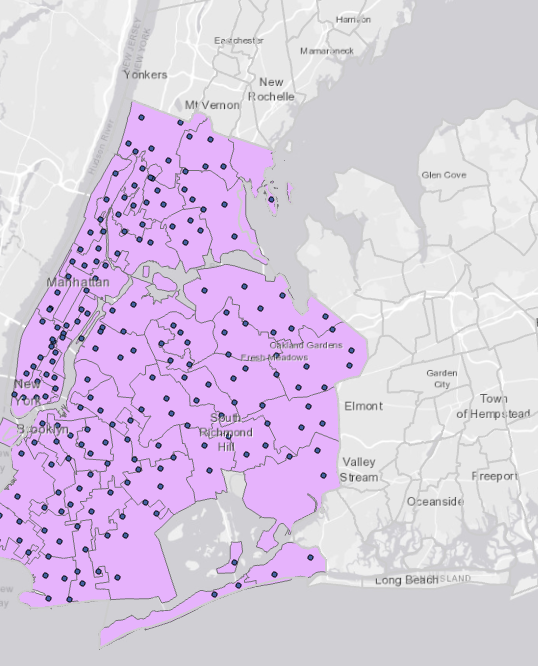
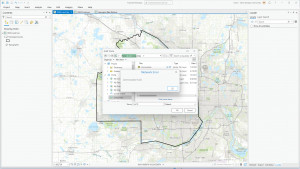
MapCh9

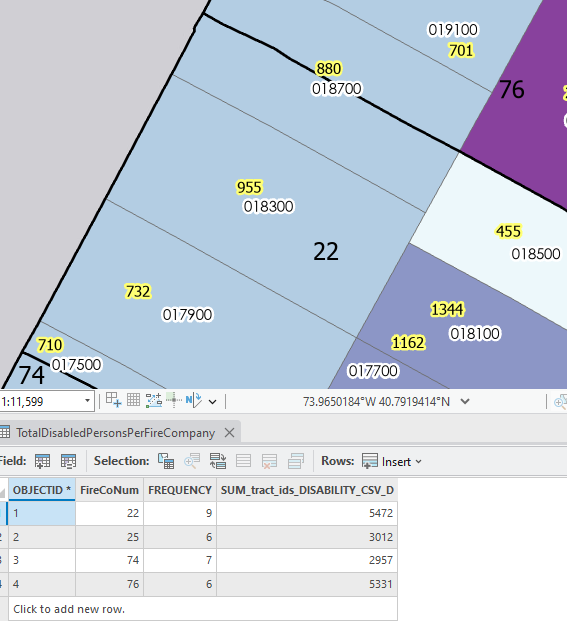
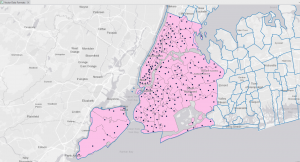
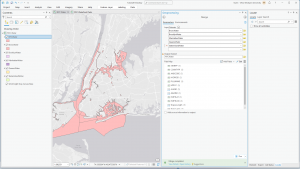
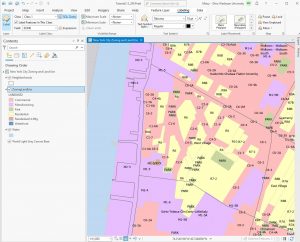
MapBuffers2(Ch9)

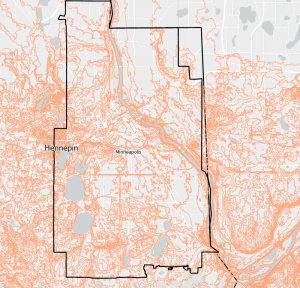
Chapter 10- This chapter was all about rasters, and it was fairly short and straightforward. This was the first time we’ve had to really use a raster dataset, so we started out by importing it and setting parameters for the raster analysis. The first tutorial showed us how to create a hillshade map to show elevation, and how you can symbolize it to better display elevation or land use. It also showed us another way to display elevation, which is to create elevation contours. I think one thing I am beginning to understand about ArcGIS is that there are many different methods to display the same thing, but it all depends on what you want to portray and how you want people to see it. The second tutorial was all about using the Kernel Density tool to make a density map, and then how to symbolize this in a way that makes the trends easy to visualize. Finally, the end of this chapter went into creating a model using the ModelBuilder feature. This section was a little challenging, but the book explained the process very well and I was able to get my model to run. This tutorial also incorporated some more coding, which I think added another layer of difficulty to it. 


Chapter 11- The final chapter in the book was pretty short and incorporated things we haven’t learned about yet, but I actually really enjoyed some of the things this chapter covered. The first tutorial showed us how to navigate through a 3D scene. Then, the tutorial went over triangulated irregular networks (TINs). The book explained that TINs are very useful in some high-precision applications like engineering, which require lots of calculations. The third tutorial goes over to how make trees using z-enabled features, and I really liked this part. I didn’t realize that creating 3D features like this was an option, and how many options ArcGIS PRO has when it comes to symbolizing the features. The tutorial had us pick a certain kind of tree species, but there were so many options to choose from. Then the chapter went into LAS Datasets, which was a little confusing, but I was able to get it all done. I was mostly just confused about why you would need to visualize the data like this, but I’m sure there are some very specific applications where this would be beneficial. The fifth tutorial went over more 3D features and had us create floors for buildings so you can view them in 3D using a range slider. Then, we had to create 3D buildings by increasing the Z height of a 2D feature. I did have a little trouble with tutorial 6, and my building wasn’t nearly as tall as the pictures in the book, but I was still able to symbolize the building correctly (it was just very short!). Finally, the last tutorial covered how to make an animation, and I got to make a little movie that moved through 3D frames!

Week 6 Tuttle

Chapter 9

First two sections went really well and they seemed very straightforward. I had a hard time finding the “Travel Settings group” in 9-3. I searched for it in the search bar and looked around and couldn’t find it. The picture in the book looked really cool so I was disappointed I couldn’t find it. The rest of the chapter was simple and I was able to finish it with no problems

Chapter 10

This was the longest section for me. I really had to muscle through the first two sections. When I got to the third I couldn’t get the ModelBuilder to work for me. I tried to skip that section but after that I think I was flustered and I just couldn’t figure out any of the other sections. I might revisit this one next week if I am stuck on the final and want to take a brain break.

Chapter 11

This one introduced 3D modeling which was very exciting. I didn’t run into any issues in this section. I had a hard time finding some of the panes because the tutorial assumed that I already knew. I wish I had taken notes or remembered where the different sections were. I had to use the search function a lot and sometimes that made it very clunky. Overall it was not too bad and I feel like I learned a lot in this chapter and through the whole book

Rose Week 6

Chapter 9


Chapter 9 was pretty simple and straightforward as it focused on spatial analysis and combining and interrupting data based on different locations. I ran into some issues finding some of the newer functions it asked me to use but I eventually was able to find them and continue on with the chapter.


Chapter 10


 For 10-1 I did not have the LandUse_Pgh file in my Chapter10.gdb so I couldn’t finish this tutorial. I am not sure why I am missing some of the downloaded data. This has been happening throughout these tutorials. 10-2 was straightforward and I was able to get through it pretty easy but 10-3 was difficult for me when I got to the point when you have to enter some expressions in the raster calculator and that did not work for me. I think I did a step wrong before that but I don’t know how to fix it. 


Chapter 11


This chapter focused on all things 3D in ArcGIS. I had some issues just because of the nature of the use of 3D but nothing too crazy. It is very cool to see things from this point of view, especially while using the program in exclusively 2D the past 3 weeks. 3D GIS is a bit daunting but these tutorials made it much simpler and easier to navigate and understand. 

Katterhenrich Week 6

Chapter 9

In this chapter, four spatial analytical methods were covered including buffers, service areas, facility location models, and clustering. The tutorials helped me understand how to use buffers for proximity analysis by running the pairwise buffer tool and multiple ring buffers. I was able to create service areas of facilities for calibrating a gravity model and locate facilities using ArcGIS Network Analyst. This chapter also taught me how to perform cluster analysis to explore multidimensional data.

Chapter 10

The tutorials had users process raster datasets to extract and symbolize maps and create hillshade maps. I learned how to make a kernel density map, or a heat map, as well as how to build a raster-based risk index model. It also required me to build a model for automatically creating risk indices. Throughout this chapter, I learned a lot about raster layers compared to vector features which we had been using previously. I found it useful when it taught me how to transform vector feature classes into raster datasets that could be visualized.

Chapter 11

In this chapter I found it useful that the tutorial had us explore global scenes and taught me how to design, visualize communicate, and analyze them. The tutorials also had me create local scenes, TIN surfaces, and z_enabled features from this I learned the difference between global and local scenes. It allowed me to create 3D buildings from the lidar data so that I could work with the 3D features. I also used procedural rules and multipatch models but the parts I found most interesting, useful, and fun were creating the trees and the animation.

Askill 6

9.1- Made first buffer easily. Done. 

9.2- Liked this one because I compared 9.1 and 9.2 together. 

9.3- Got to step 6 but couldn’t complete the tutorial because I couldn’t find the travel settings group button. I looked it up on google and the search bar on GIS. 

9.4- I got all the little green dots on the screen. (INCOMPLETE)

9.5- I liked changing the names and colors of the dots. I was able to do this one. 


10.1- Done. Saw the map shift colors and got different dimensions. 

10.2- Tried. Got done with the first part then couldn’t find the correct layer to symbolize. I tried every layer but couldn’t find one layer with all of the correct things to put in.

10.3- I tried entering the code into the raster calculator and double checked it but it didn’t work. I just entered the names and numbers, but it didn’t really work for the rest of the tutorial. So I just moved on to chapter 11. 


11.1- I liked playing with the different keys and changing the layout of the map. 

11.2- Followed the book but some of my map was cut off. Probably a small mistake I made. But I was able to finish this tutorial. 

11.3- Favorite tutorial yet. Made the trees. 

11.4- The first part of this looked cool with the little dots making up the buildings. I also liked creating the bridge. 

11.5- Done. Interesting to see the different layers in both buildings. 

11.6- Struggled a little bit but finished. I liked looking at the street view. 

11.7- Making the short animation was really cool because you got a mini tour of the city. 


Shaw Week 6

Chapter 9

9.1: This was just using the clustering tool, very easy.

9.2: The first half of the tutorial was very straightforward and easy but when using the spatial tool I was having trouble using the output field.

9.3: I had the same issues as 9.2, the spatial tool was hard to navigate, I am not sure if updating the software will fix it or not.

9.4: This part was very similar to the rest of the chapter with just changing the map to be able to read it better.

9.5: This part was very straight forward, just changing the symbols names and indicators.

Chapter 10

10.1: This was the longest tutorial of the chapter but it was very easy to follow after the first part which I had difficulty with. This section does involve a few new tools.

10.2: This tutorial was very easy, just introducing new tools to get familiar with. I am not super familiar with the singular tool or clustering tool yet but these sections have definitely helped.

10.3: This section proved to be very long and gave me some difficulty with the coding. I could not figure out how to connect the raster calculator to everything else.

Chapter 11

11.1: This tutorial introduced the 3d view for the map, was very short and easy to follow. 

11.2: This tutorial is very easy to follow. It is very similar to 11.1. 

11.3: The use of the 3d features are very cool. The section was again very similar to the last two. 

11.4: This section was cool building things but my outcome did not look like the books so I am sure something went wrong.

11.5: The slider tool on this tutorial was very interesting, this was a very interesting tutorial to use. 

11.6: The street 3d view was very interesting and I enjoyed doing it.

11.7: This section tied the chapter together, it was definitely hard at first but I learned a lot.