Hello everyone! My name is Samuel Baer. I am a sophomore majoring in both Environmental Science and Geography. I am a part of the honors program, the symphonic wind ensemble, and Cru. I’m from Mt. Gilead, Ohio which is about 30 minutes from here. I am a commuter so it feels like I’m always driving.
To me this chapter was really interesting. One of the first things that really stood out to me was the fact that GIS has been around since the early sixties. To me it just doesn’t feel like something that would have been made that long ago. I find it interesting that Canada was one of the first nations to develop it, but I don’t find it surprising due to the amount of unpopulated area in Canada. I find the idea of GIS starting in the quantitative revolution is interesting, and it makes sense to me, even though it contains a visual component. It’s really fascinating how philosophical a mapping program really can be. Whether it’s talking about whether it’s more quantitative or not. Also The idea of GIScience is really interesting to me. Specifically studying how to interpret GIS. I had heard of GIS before the course but I didn’t realize how big of a topic it was. I think studying GIS would be more interesting to me rather than GIScience just because the idea of practice is more appealing to me. This chapter made me really excited for the course because the author is very passionate and thorough.
First Search: GIS in Subway Systems
GIS can be applied to public transportation systems such as subways, bus routes, trains etc. Mainly it is used for the navigation between stops. GIS can also be used to track patterns in traffic and even track it live. With GIS, city planners are able to plan and analyze data with more precision. The maps can be automated to plan routes and determine schedules. It also can allow planners to pick more efficient stations and maintenance facilities. https://www.iunera.com/kraken/public-transport/geographic-information-system-gis-public-transit/#:~:text=A%20GIS%20gives%20the%20transit,Useful%20in%20map%20production
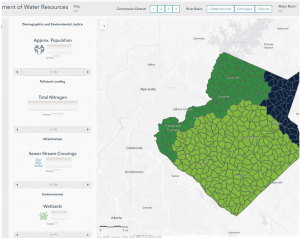
Second Search: GIS uses with Watersheds
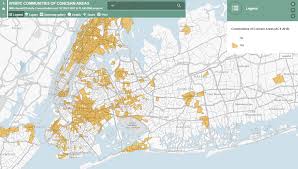
https://www.hazenandsawyer.com/projects/using-gis-to-visualize-watershed-priorities-in-real-time
Hazen has applied GIS in Gwinnett County, Georgia. By adding layers of land use, septic parcels, and sanitation, they created an interactive map that allows them to determine where their priorities should be. They are able to slide the data, and the map will change to show where the priorities lie.