Geog 291 Week 1 Updates

< Could be asked of many gilly creatures. What about whales and their blowhole?

Remember to post your stuff to WordPress by end of the day, end of the week (this week and every week.

Email me with any issues.

A few updates and common issues:

If you want to borrow an external hard drive for the semester, contact Angela Moore (in 201: almoore@owu.edu).

Log in to the WordPress site on this page (right side, scroll down to Login)

Log into OWU ArcGIS Online here

Bzdafka – week 1 


Hi everyone, my name is Alex Bzdafka. I am a biology and environmental science double major here at OWU. I’m a junior and I’m on the track and field team, my main event is pole vault. I’m excited to be learning GIS because being able to utilize spatial data is something I am unable to do currently and it will be very helpful for my future research and career. I focus my course work on plant ecology, and my research is on plant-pollinator interactions. 

The week started out by reading the syllabus and the schedule, followed by taking the quiz and acing it. After that work I did the reading, which explained some history behind GIS and how it was essentially developed a number of different times and by different individuals and groups. I found it interesting how the book listed a number of uses for GIS and how versatile of a software it truly is. The book also interestingly discussed the differences between GIScience and GISystems. GIScience is more of the computer science and mechanistic study of GIS itself and how the program functions. GIScience also looks into the validity of the program and how it defines polygons when tasked with isolating or grouping spaces. GISystems is more of what we (the students) are, and what we are being trained in; as GISystems is the actual use of GIS in assisting with projects. 


After completing the reading I looked into some of the uses for GIS. The possibilities are seemingly endless as the software is very broad and can be used in many different capacities as long as you are willing to be creative with it. The most basic use case of GIS is to visualize space, however it is also a powerful tool for visualizing data similarly to a graph. The main uses I see for GIS are in agricultural consulting (which I plan to do in the future), as I can display soil conditions on various properties, and track it over time. I can also use it to visualize water movement which can be used as a proxy for soil infiltration rate. I also would likely use GIS to map percent plant coverage (not grass) to show plant diversity, and soil coverage which prevents splash erosion and soil compaction by rain. I have mainly seen GIS used  in literature for categorizing land use types, such as urban/developed, natural, semi-natural, and agricultural (Geslin, et al. 2013). 

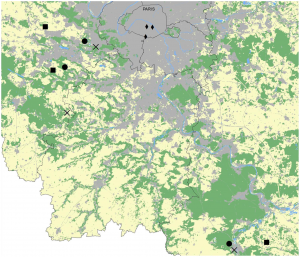
Map showing natural status of given areas. In green are natural areas, beige are semi-natural, and grey are urban/impervious areas. 

Geslin, B., Gauzens, B., Thébault, E., & Dajoz, I. (2013, May). Plant pollinator networks along a gradient of Urbanisation. Plant Pollinator Networks along a Gradient of Urbanisation. https://journals.plos.org/plosone/article?id=10.1371%2Fjournal.pone.0063421  

Evers, J., & Editing , E. (2025, June 5). GIS (Geographic Information System). Education. https://education.nationalgeographic.org/resource/geographic-information-system-gis/


Marzulli Week 2

Chapter 1- This chapter introduced me to using ArcOnline, which was a different experience compared to what I had learned in Geog 291. At first, I was able to follow along easily, but as I got further into the chapter, I ran into challenges when working with data layers. One of the biggest issues was figuring out how to properly format my data so that it would display correctly on the map. I had to go back and double-check my work multiple times before it finally looked right.

Another part that I found difficult was understanding how to adjust the symbology settings to better represent the data. I wanted to make the map more visually clear, but I struggled to find the right colors and symbols that would best display the information. After experimenting with different options, I started to get the hang of it. I realized how important these small details are in making a map both informative and easy to read.

Chapter 2- Going into this chapter, I was feeling more confident, and overall, things went more smoothly. One of the first tasks was working with attribute tables, which I found really helpful in organizing and understanding the data. Being able to filter and sort information within the table made it much easier to see patterns in the dataset.

A challenge I faced in this chapter was trying to properly configure labels for the map. I wanted certain features to stand out, but some of the labels were either too small or overlapping in a way that made the map look cluttered. After adjusting the settings multiple times, I was finally able to make the labels clear and readable.

By the end of the chapter, I felt a lot more comfortable with these tools, and I started to see how all the different elements—layers, symbols, labels, and attribute tables—come together to create an effective map. I’m looking forward to applying what I learned to more complex projects in the future.

Marzulli Week 3

Chapter 4 is about mapping density, which is useful when analyzing areas of different sizes. Density maps help show patterns rather than individual points or connections. There are two main ways to create a density map. The first method is by using defined areas. This is a quick and easy way to display data that has already been summarized. However, it’s not the most detailed method since it doesn’t come directly from raw data. If extra detail isn’t necessary, this method is a great way to visualize patterns. The second method is by using a density surface. This approach is more detailed but requires a lot more data input since it doesn’t use pre-summarized data. It looks similar to raster models because it uses layers and cells. It’s also possible to switch between the two methods by assigning values to summarized maps. Factors like cell size, search radius, calculation methods, and units impact how the final map looks.

Chapter 5 focuses on taking a closer look at maps to understand how different features, values, and layers work together. It also revisits the idea of discrete versus continuous values. Discrete values are unique and identifiable, like locations or addresses. Continuous values can be numerical or categorical, but they vary across an area.

This chapter also explains different ways to study areas and features. One way is by looking at the overall areas and features, which gives a quick visual representation but doesn’t provide specific data points. Another way is by selecting inside an area, which gives precise information about that space but doesn’t help with anything outside of it. Lastly, overlaying methods combine multiple layers of data to create a more detailed view. This method is useful but requires a lot of data input.

There are also different ways to display maps. One option is using lines and locations, which uses thick lines and dots to mark specific places. Another option is discrete areas, which map distinct features like buildings or rivers using lines or shading.

Chapter 6 begins by discussing the difference between mapping by distance versus cost. Distance mapping is usually enough, but it’s not always the most detailed option. Cost mapping considers travel expenses and effort, making it more precise but also more complex. This fits with a common theme in the book: more detailed methods require more data and effort.

The chapter also introduces planar and geodesic mapping. Planar mapping assumes the Earth is flat, which works for small areas. However, for larger areas, geodesic mapping is needed to account for the Earth’s curvature.

Different methods can be used to analyze distance within a map. District bands help compare distance with other characteristics, while inclusive rings show how totals increase as distance grows

Creating buffers is another important concept. Buffers define boundaries around values, helping to highlight edges and centers. The rest of the chapter focuses on how to apply these methods in real-world mapping. I’m curious to see how all of this will come together when we start working through tutorials and applying what we’ve learned.

Fondran Week 2

Chapter 1:

This chapter had similarities to what I did in Geog 291 but was different since it is applied to ArcOnline. I started strong but quickly got confused when trying to upload the Redlands data. As I continued, I was able to familiarize myself with each of the tools and discovered there is a lot you can do. I think this chapter was well explained but lacked some necessary pictures I felt I needed to better understand what I was doing. As I navigated through 1.4 I ran into another issue, I was unable to complete step 11, I could not find the “select layer field or sort by”. Anytime I clicked where it would be, it disappeared. I reviewed other students’ maps in our organization, and mine did not resemble theirs, but I tried. 

Chapter 2:

I started this chapter with excitement and optimism that it would go better than the first chapter. This went a lot smoother, and I was able to successfully create a hosted feature layer using geocoding. In 2.3 it was asked to configure pop-ups, something I struggled with previously. I enjoyed this part because it made the map easier to understand and more useful than before. While creating my story I could not find the “Map Action” button and could only find the “media action” one. I also could not find the “swipe” button when adding it to my sidecar. I ended up finding it but put it in the story separate to the sidecar narrative. I have mad a story before but doing it a second time I feel much more confident in my ability to create my own.

Applications:

I have lived and gone to school in many different places including Stuttgart, Germany because of my dads different job placements while serving in the Coast Guard. Each location and school I went to varies and I could make a heat map that measures the amount of time I attended each school. Where a warm color would represent a longer time stayed and color tones would be short times. I possible could couple this with an express map, that would allow me to place arrows and annotations to explain each area.

Heumasse Week 7

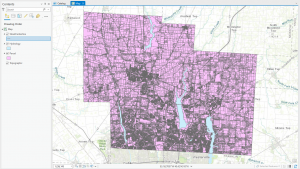
Address Point: Represents all certified addresses in Delaware County. These addresses are
updated daily, with updates published monthly.

Annexation: Tracks annexations and boundary changes in Delaware County since 1853. Here,
annexation simply refers to territorial adjustments.

Building Outline: Contains outlines and structures of all buildings in Delaware County. The
most recent update was in 2023.

Condo: Includes all condominium polygons within Delaware County.

Farm Lot: Identifies farm lots within both the U.S. Military and Virginia Military Survey
Districts.

GPS: Contains all GPS monuments established in 1991 and 1997.

MSAG (Master Street Address Guide): Used for defining political jurisdictions in townships,
cities, and villages throughout the county.

Map Sheet: Represents all map sheets within Delaware County.

Hydrology: Maps all major waterways, rivers, and streams within Delaware County, enhanced
using LiDAR data.

Municipality: Contains data on all municipalities within Delaware County.

Original Township: Displays the original township boundaries before tax districts altered their
shapes.

Precinct: Contains data on voting precincts within Delaware County, sourced from the Board of
Elections.

Recorded Document: Includes recorded documents from the Delaware County Recorder’s Plat
Books, Cabinet/Slides, and Instrument Records that are not represented by active subdivision
plats. Used for tracking miscellaneous records in the county.

School District: Shows the boundaries of school districts within Delaware County.

Street Centerline: Represents the center of pavement for public and private roads in Delaware
County. This dataset was developed using address information.

Subdivision: Contains subdivision and condominium records for Delaware County.

Survey: Includes shapefiles of point coverage representing land surveys within the county.

Tax District: Defines tax districts as determined by the Delaware County Auditor’s Real Estate
Office.

Fondran Week 7


Address point- Contains all valid addresses in Delaware County and is updated frequently

Annexations- All the annexations  updated on an as-needed basis in DelCo and  is updated monthly

Building Outline-  Building outlines for all structures in Delaware County, Ohio, and was last updated in 2023

Condo- All condominium units in DelCo

Dedicated ROW- all lines that are designated Right-of-Way it is updated daily and published monthly

Delaware County E911 Data- this layer is intended to provide emergency services with information needed to comply with Phase II 911 requirements. It provides the capablity to find the closest valid adress through reverse geocoding.

Farm Lot- All farm lots in US Military and Virginia Military Survey Districts of Delaware County. It is updated on an as needed basis.

GPS- all GPS monuments that were established in 1991 and 1997 and is updated as needed

Hydrology- Contains all major waterways in DelCo and is updated as needed

MSAG (Master Street Address Guide)- Includes the 28 different political jurisdictions in DelCo

Map Sheet- All Map sheets in Delco

Municipality- All the municipalities in DelCo

Original Township-Original boundaries for townships prior to tax district changes

Parcel-includes all cadastral parcel lines in DelCo and is updated monthly

Precinct- Includes all voting precincts in DelCo and is published as needed by the DelCo Board of Elections

Recorded Document- Includes points of recorded documents  in the Delaware County Recorder’s Plat Books, Cabinet/Slides and Instruments Records

School district- Includes all school districts in DelCo and is updated monthly

Street Centerline- Includes all pavements of public and private roads in DelCo and is updated daily and published monthly

Subdivision- Includes all subdivisions and condos in DelCo and is published monthly

Survey-point coverage that represents surveys of land in DelCo

Tax District- All Tax districts in DelCo and is updated as needed

PLSS-created to facilitate in identifying all of the PLSS and their boundaries in both US Military and Virginia Military Survey Districts of DelCo.

Zip code- Contains all of the zip codes in DelCo and is updated on an as-needed basis

Township- Contains the 19 townships in DelCo and is updated on a as needed basis

Parcel, Hydrology, and Street Centerline- Delaware County