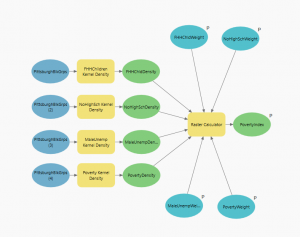
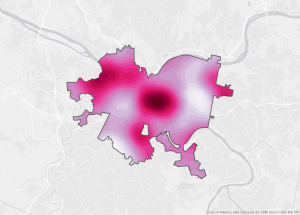
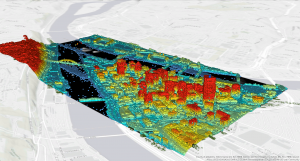
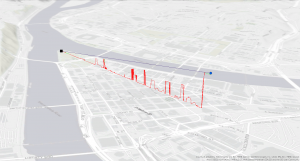
Crane Week 1

My name is Zachary Kyan Crane, going by Kyan, and I am currently an Environmental Studies major. I am from a small town on the West Virginia side of the Ohio River named New Martinsville (about 45 minutes to an hour South of Wheeling). I’m a big fan of skateboarding/snowboarding (bad at both though), biking, and just about anything you can waste your time doing on a tv/pc.

If I was asked to create a new slogan for GIS it would go along the lines of “Seeing is Believing.”  In my opinion from what I gained from the chapter, GIS is a tool used to streamline and organize geographical data through visual imagery. It is clear that the way that any data is visually represented for the human brain to comprehend is imperative for any kind of planning or organization. I can totally see myself struggling to understand data points on a representing graph more than a comprehensive map. Within this humanization is the incredibly important need to organize a large amount of different points of data into one maneuverable format. I’m actually pretty excited to see all the different layers that a map can have and all the different variables that can be brought into one space. However, there is a need to recognize that this is not the end all of mapping and that GIS is more of an organization tool than a computing tool. I understand that for anyone using GIS it is still important to be able to actually understand the data being visualized so that I can be added upon, changed, or used for a project of some sort. One thing about all this that I felt seemed somewhat given were all of the different uses of GIS. It makes a lot of sense to me that many different projects and jobs use this technology to plan and understand the land that they are working on. It is incredibly important to understand the setting of whatever is about to happen.
One of the first things that came to mind for something that uses or is similar to GIS is a video game called Cities: Skylines. Its just a game where you build a city, but there is a complex info panel that shows you everything from mineral deposits to the happiness of your citizens. The 20+ overlays that can be accessed are all needed to sufficiently run your city.

https://www.esri.com/about/newsroom/arcnews/arcgis-urban-transforms-city-planning/

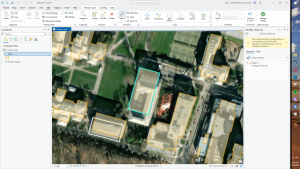
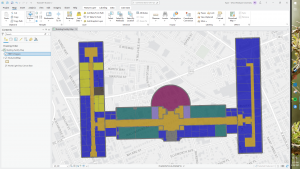
This is what this kind of thing looks like for real life applications in urban planning. Another good application that can relate back to urban planning is how to engineer the structures that have been assigned somewhere to be built.

https://www.esri.com/en-us/industries/aec/business-areas/design-engineering

Smith Week 1

Hello! My name is Owen Smith, I am currently a senior at Ohio Wesleyan University, majoring in zoology. I am in the application process for jobs after school, I would like to be a game warden. I was interested in taking GIS courses because I will use them in the field I plan on working in. I wanted to familiarize myself with GIS and master how it works.

As I went through the reading, it was very thought-provoking, and I had many comments and questions. My natural inclination toward GIS and mapping as a whole was strictly limited to the geospatial mapping of physical formations. Thankfully, I have taken classes with Ashley Toenjes as she has poked many holes in my definition of what GIS is. while reading, I realized how succinct her classes and definitions were with what Schuurman was saying on page 3.  When they spoke about the identity crisis that GIS faces. Another thing I found interesting was how new GIS is, in the grand scheme of mapping. Logically, it makes sense though, the computing power needed to make these extremely complex maps has only recently become accessible for most everyone.

One application of GIS that I found applied to me was the use of data analysis in the workplace. As an outdoorsy person being able to use GIS opens up a plethora of job opportunities. For example, the state of Montana is actively hiring employees to use GIS and analyze natural resource data. I chose to look into invasive plant species in Siberia. Having taken several plant/climate-based classes. So, looking into the mapping of invasive plant species and thier migration due to climate change was something that really stuck out to me.  The attached map is just one of the several images used to show the locations the invasive species were found.

Kopelcheck Week 1

Hi! My name is Grace Kopelcheck and I am currently a senior majoring in zoology! I currently work at the Columbus Zoo and Aquarium as a seasonal zookeeper in the  Animal Encounters region (right next to the sea lions!). I have also volunteered at the Ohio Wildlife Center for a little over a year, as well as have interned in the Asia Quest region for a semester! Currently this semester I am interning at Cosi with their animal care team!

When reflecting on the reading I had many comments and thoughts throughout the reading. Firstly when reading the first page I was shocked to learn that GIS can rationalize organ donations. I always thought that GIS was used for more land mapping, but I did not realize the full extent of the content GIS can create/explore. I also never realized the social implications of GIS and what it can do to expand on things other than land. It’s also interesting to read that GIS is considered to have an identity crisis. I think this is funny as well as interesting as I even thought of a different identity for GIS than what it has been used for. I also find it interesting how much we have utilized GIS even though it was stated in this paper that it was a newer technology. This use of newer technology becoming an upcoming feature for many companies and usage reminds me of AI and how this a new very utilized technology as well. It was also interesting to read how one challenge GIS faces is being able to draw strict boundaries represented with lines drawn from GIS. Overall this reading was interesting and gave me a better understanding of the capabilities that GIS has and can do.

For looking into sources of GIS applicable/interesting to me, I used the key subject of Virginia Opossum (as they are my favorite animal) to find GIS application. I found two interesting articles talking about the population distribution of Virginia Opossum and how they move towards human populations due to food (Beatty et al. 2016). Another article tracked the same information however with road kill found and the findings of human influence land types and the amount of roadkill found had negative correlations (Kanda et al. 2006). GIS proves useful in tracking local populations of animals! Below are some GIS maps from both these articles that show the land that Virginia Opossum were found to inhabit (both dead and alive).


Beatty, W. S., Beasley, J. C., Olson, Z. H., & Rhodes Jr, O. E. (2016). Influence of habitat attributes on density of Virginia opossums (Didelphis virginiana) in agricultural ecosystems. Canadian Journal of Zoology, 94(6), 411-419.

Kanda, L. L., Fuller, T. K., & Sievert, P. R. (2006). Landscape associations of road-killed Virginia opossums (Didelphis virginiana) in central Massachusetts. The American Midland Naturalist, 156(1), 128-134.

Yates Week 1

My name is Spencer Yates, and I am a microbiology and zoology major. I’m currently applying to graduate schools with areas in virology.  The reading was very interesting to me. I had no idea that GIS software was so important to modern research and engineering. I thought it was just for geographic research, but it’s much more broad than that. The creation of the GIS software is also fascinating, as it involved so many people all across the world over a large period of time. It is kind of hard for me to understand so far, as I’ve never really done mapping before. However, I am determined to master GIS by the end of this course. I think that this skill will be really useful for me in the future.

When I looked for applications of GIS that are interesting to me, I chose two categories: professional interest and personal interest. For professional interest, I looked up if GIS is useful for tracking the progression of diseases. There are a lot of examples of this, but I found a recent malaria study using GIS mapping to explore the prevalence of the disease in Nigeria to be the most fascinating. The paper used GIS mapping to show the changes in prevalence in areas of Nigeria over a 20-year period, which is incredibly useful to know.  Source: https://link.springer.com/article/10.1007/s00436-024-08276-0#Tab2

As for a more personal interest, I chose butterfly migration and conservation. In this category, monarch butterfly migration and habitat appeared to be a highly studied area. I found an interesting example of mapping the amount of suitable overwintering habitat for monarch butterflies in Mexico. While this map is only for one point in time, making similar maps in the coming years can allow for the tracking of habitat gain and loss, which can let researchers know if conservation efforts are effective or not. Source: https://creeksidescience.com/what-we-do/gis-analysis/

The blog is not letting me upload either of the maps I found, but they are in the links if you want to see them.

Hickman Week 1

Hello! I’m Ariauna Hickman. I’m from Pittsburgh Pennsylvania. I’m a sophomore, majoring in Pre-Professional Zoology on the Pre-Veterinary track. I am also double minoring in business and chemistry. A quick fun fact is that I have a Great Dane who is a goofball.

After reading Schuurman ch. 1, it is clear to see how important GIS is in many different career choices. I like how it can be used for many different things. The part where it mentions how municipalities use it for things like affects on highways, however, confuses me a bit. How are they able to tell how it affects those areas? Now that I read the next page, my question was answered. It is to see how it would work with landscapes and housing. It is crazy to think about how more than 50% of our brains neurons are used for visual intelligence. No wonder GIS is so important. It is like a visual way of seeing geographical locations. The visuality is used as a means to be able to make it more accessible to see the patial awareness of areas.

After looking at a few different ways that GIS is used. I found how it can be used for video games.  For example, Watch Dogs 2 usesGIS in the way that it is open world. They made it highly detailed and realistic with the urban planning, architecture, and digital infrastructure. GIS is also used in Pokemon GO. People go around using a geographical map that matches their location to go and catch different pokemon. It is a blend between the physical and digital world.

, , , , , ,

Geog 291 Week 1 What To Do

Don’t drown in Geog 291!

All you have to do is one thing. Keep up.

Any impediments to keeping up and turning things in on time (every Friday): talk to me.

Just about everything you need is on this lovely website.

What to do by the end of the day Wednesday, Jan. 15

1) Read over the class web material here carefully: the Syllabus, Schedule, Data Inventory and Final Exam tabs above.

2) Accept the invitation to post on this site from WordPress. Thanks to those of you who already did this.

3) After reading over the web materials, set up an appointment with me the first week here.

After that, what to do the rest of the week:

1) Log in to this site and post this week’s work by midnight Friday, Jan. 17. It’s an easy one.

2) Watch for an email from ESRI / ArcGIS for your ArcGIS Online Account. You need this to use the ArcGIS Pro software in the GIS lab.

3) Get the books for the course or plan to use the ones in the drawer in back of 207 SCSC (top, nearest door). Don’t take those books out of the lab.

I just sent in a request for you all to get 24/7 access to SCSC and emailed you (earlier) the access code for the GIS lab (207 SCSC).

Email or catch me around or set up an appointment if you have questions.

Kelner Week 6

Chapter 9:

This chapter went pretty well aside from some bumps here and there.  I struggled to find stuff occasionally but other than that it was good.

Chapter 10:

Like chapter 9, this one was smooth as well.

Chapter 11:

I struggled a bit with this chapter but all in all it went decent. Usually it was me struggling to find something or I just couldn’t figure something out so I moved on. The chapter was mildly annoying but it shows some pretty cool ways to show data.


Norman Week 6

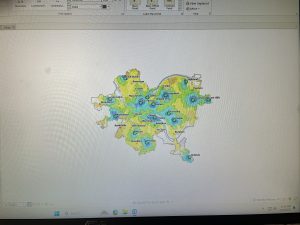
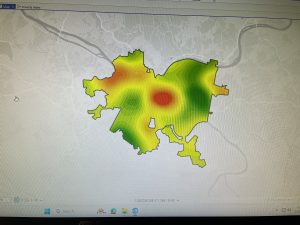
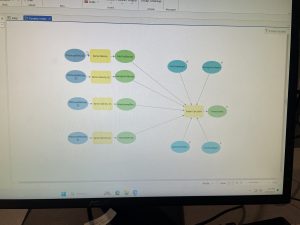
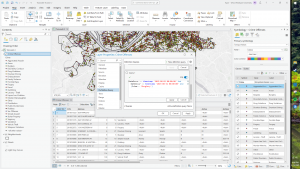
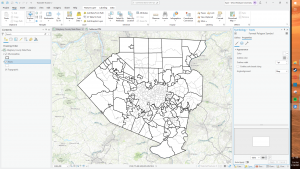
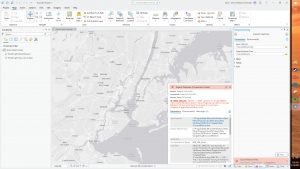
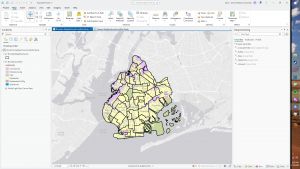
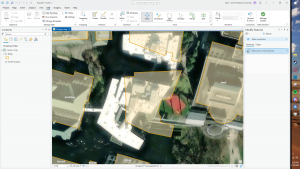
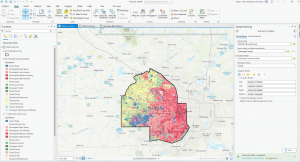
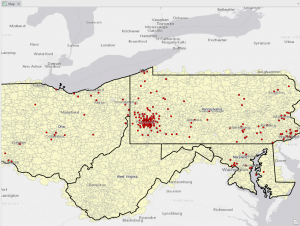
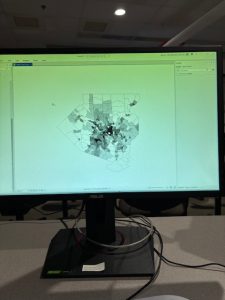
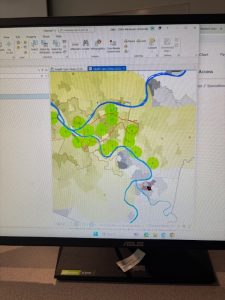
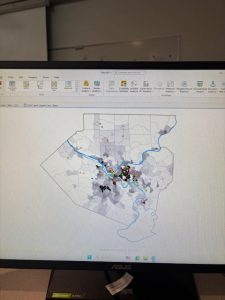
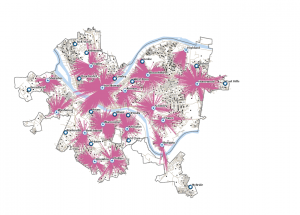
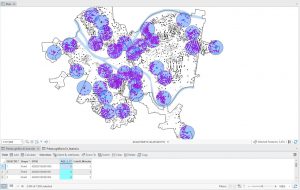
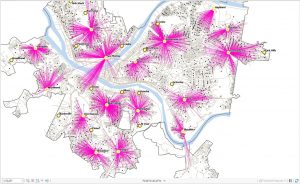
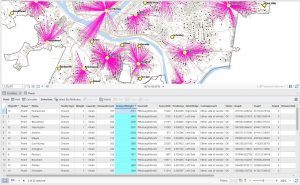
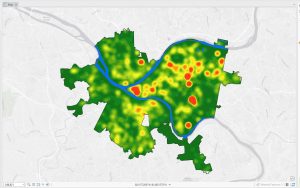
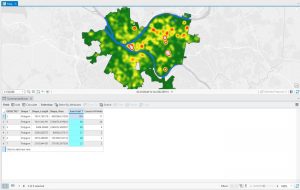
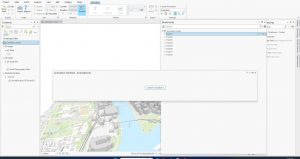
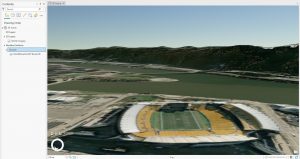
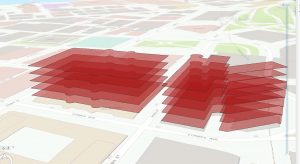
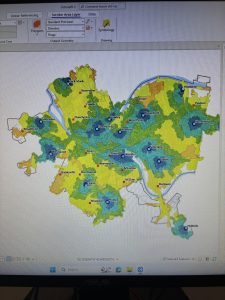
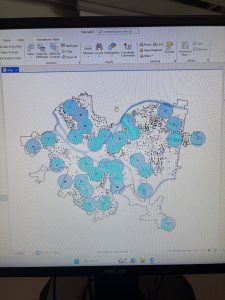
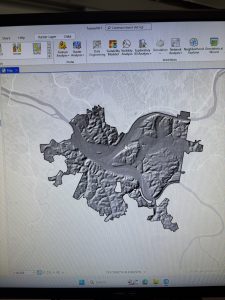
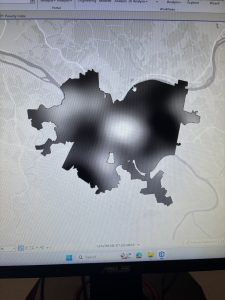
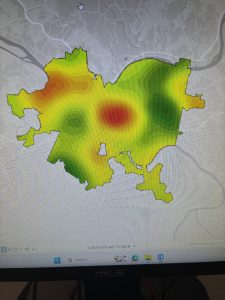
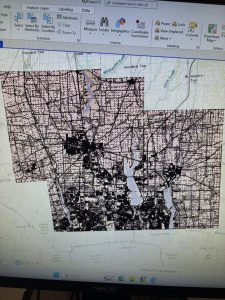
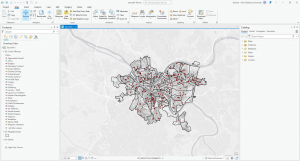
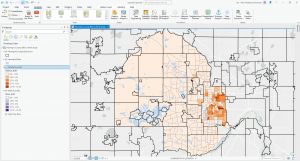
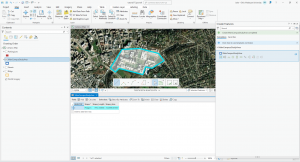
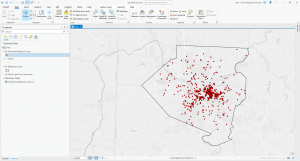
Chapters 9 and 10 went fairly smoothly for me. Definitely more complicated than the previous chapters, but I also found it to be very interesting and helpful. I ran into a few issues with the Chapter 11 tutorials, but if it took too long trying to figure things out, I would move on and it went pretty well. I liked that these chapters showed more intricate ways to represent and symbolize data. These are the kind of maps you see a lot, so it was cool to be able to make them myself and see how much I had improved with the intricacies and details of the software. Attached are screenshots of a few of my tutorials

Kelner Week 5

Chapter 4:

This chapter went pretty well and I didn’t really run into any issues. If I ran into a roadblock I sorted it out pretty quick.


Chapter 5:

I struggled a fair bit with this chapter. I had trouble with my data and with adding it into ArcGIS. I had some mapping and software issues as well, like for example I wasn’t able to find the Display XY Data button. All in all this chapter put me through the ringer and I’m glad I was at least able to get bits and pieces done for it.

Chapter 6:

This was a much better chapter compared to 5. Honestly it went smoothly and I had the same issues as I did in 4 of just struggling to find stuff.

Chapter 7:

Again, the chapter went smooth and really enjoyed playing around with the polygons.

Chapter 8:

Very straight forward and easy. I finished this chapter up fairly quick.

Deal Week 7-8

Final

I chose to do option 1. Selecting and Classifying Land Uses for my first half of the final. I first created a map and inserted the data file. Then I opened the attribute table of the Parcel layer and used the select by attributes tool to create queries of all of the different land uses. I used the provided land use codes to select each section and then used the create new layer with selected attributes button to create a new layer for each of the land uses. I created 5 separate layers of land use, as Delaware does not have any land that fits the mineral land use classification. I then color coded these layers. I then did the same process to map agricultural uses. Excluding Tobacco and vegetable farms, as well as greenhouse farms as we do not have these in Delaware.


For my second option I chose to do 2. Making New Shape Files from Existing Shape Files. I decided I would make a map showing the proximity of roads to different land use types. I did this by finding and imputing a data set that showed all of the roads in Delaware, I then used the same Parcel data set from selecting and classifying land uses, and went through the same process. I opened the attribute table of the Parcel layer and used the select by attributes tool to create queries of all of the different land uses. I used the provided land use codes to select each section and then used the create new layer with selected attributes button to create a new layer for each of the land uses. I believe this map could be useful for land use planning. Land use planning often involves analyzing the proximity of development to roads and infrastructure. Selecting specific types of land use near major roads can help assess urban sprawl or development impacts. Urban planners could use this map to assess land development patterns and ensure sustainable growth or identify areas where development could cause traffic congestion. To make the map a little more clear I also added in a hydrology layer to delineate where waterways are present between the roads.