Brock Week 1

Introduction:

  • Hello! My name is Liberty Brock, and I am a senior here at OWU. I am double majoring in Botany and Environmental Science. Iā€™m from a small, rural town in the foothills of Appalachia Ohio. I have always loved being outdoors so that is where a lot of my passion for nature comes from as well as my motivation behind my majors. My hobbies include hiking, reading, anything artsy/crafty, running, and spending quality time with my friends.Ā 

Schuurman Reading: Chapter 1

  • After reading the first chapter of this book, I feel more confident with taking this class. I have little to no knowledge or past experience in GIS and Iā€™ve honestly had a little bit of a love hate relationship with the thought of GIS. Before reading this chapter, I didnā€™t really understand the basics of GIS and I think thatā€™s kind of what has turned me away from wanting to take one of these courses. Now, I understand the versatility and importance of this system and how it can even improve the overall well being/quality of life. Even though this system is more complex than it’s face value of being a mapping system, I think that almost makes it easier to comprehend. From my interpretation, it seems as though the GIS system is comprised of algorithms and stages rather than being a whole system functioning at a base level. There are a multitude of different pieces that allow the whole system to function as one similarly to how a puzzle works. Each piece of the puzzle doesnā€™t really represent the entire image of the puzzle when looking at the pieces alone, but those pieces interconnected together create this ā€¦ I really enjoyed learning about the different functions of GIS and that they extend beyond fields in Environmental Science and Geography. Before reading this, I didnā€™t realize that GIS was prevalent in social work issues as well such property definitions, tax assessment information, and etc. Additionally, I really enjoyed learning about the history of GIS and how the roots of GIS trace all the way back to 1962 from a landscape architect, Ian McHarg, who created the concept of overlay.

GIS Application

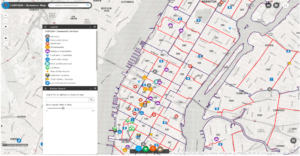
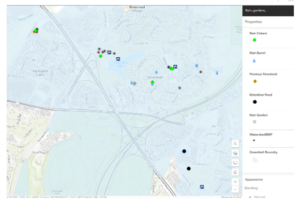
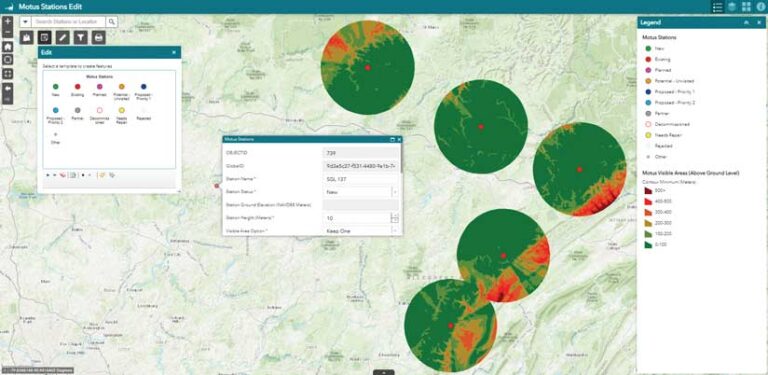
  • I’m really interested in how GIS could be used to map invasive species in an area. Using google, I searched for ā€œGIS mapping applicationsā€ and ā€œinvasive plant speciesā€ to see how GIS is being used to track the movement of invasive species. It seems like there is limited information over this topic though, which makes sense because I can imagine that this is difficult to track. https://www.stanleyparkinvasiveplants.com/SPinvasivePlantMapping.pdf
  • GIS image
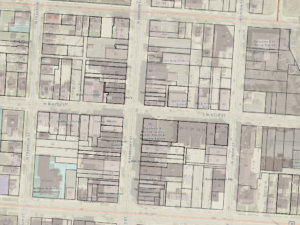
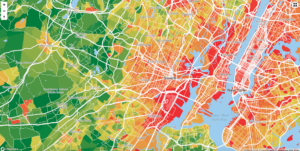
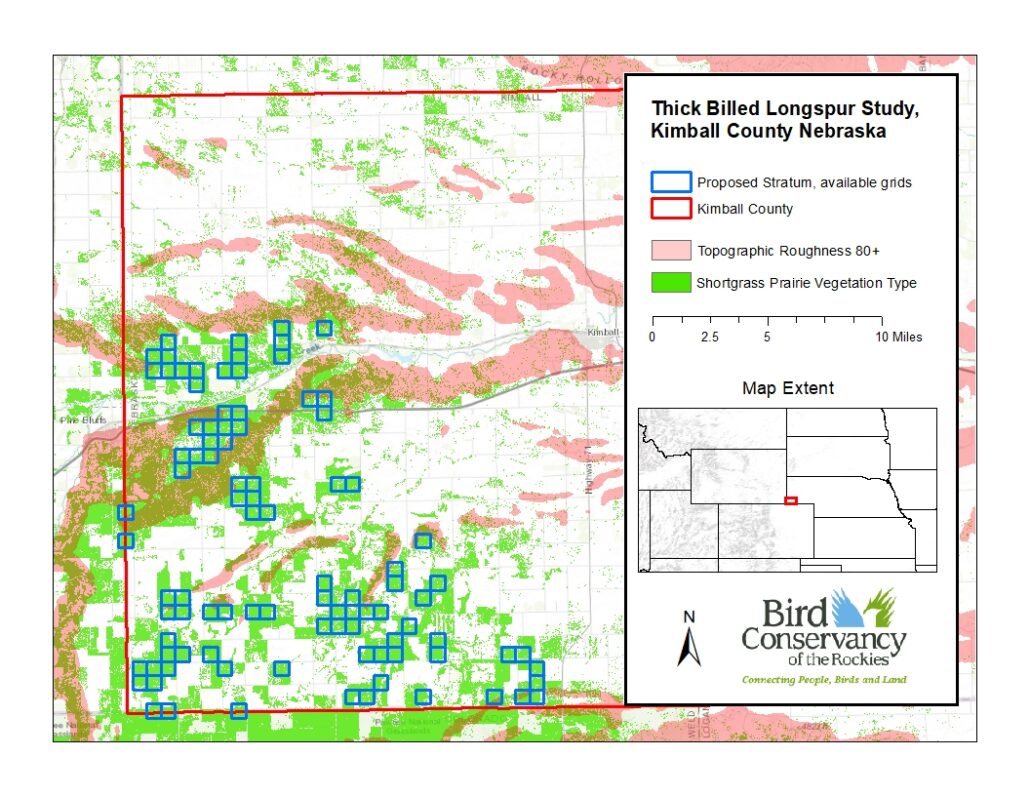
  • I’m also interested in how GIS is used to optimize agricultural production.Ā  Using google, I searched for ā€œGIS mapping applicationsā€ and ā€œagricultureā€ to see how GIS is improving crop outputs. https://smallfarms.cornell.edu/2017/04/use-of-gis/

Shaw week 1

Hi, my name is Ethan Shaw and I am majoring in Economics with a minor in Accounting from Woodland Park, New Jersey. I am hoping to find a job in finance or consulting after I graduate this May. I have never used ArcGIS or any GIS software, this class seemed interesting to take.Ā 


I never realized how much GIS is used outside of the environmental field of work. I was interested in taking this class because in the professional world especially in economics when looking at developing nations or areas in the US. I did not know there was a difference between mapping and spatial analysis and that there were different variations of mapping in GIS. I also never knew that GIS was a technology that has been around for over 50 years and always thought of it as a new technology that was just being discovered, it is also amazing to me that GIS started without using a computer and just handwriting code out. GIS is now being used in many different industries. I was completely unaware of just how much GIS is used in our day to day lives and what decisions are made by it.Ā  GIS is used in many municipalities when determining crime rates and how these are affecting the areas. These maps are also able to tell you why areas see more crime than others and why there might be a spike in a certain crime. GIS is also used in many large companies to help with growth within the company. Large fast food companies use GIS to determine based on all sorts of factors where the best place would be for their restaurants or stores.Ā 


The map below is of the crime rates in Essex county NJ. Mapping this out allows officials and people to know generally what areas are seeing more problems than others and what type of crimes are prevalent in these areas.

This map shows the urbanization of Teton county Wyoming. This is showing like most sought after vacation spots in the US how masses of people moving in are slowly taking over and leaving these places almost unrecognizable.

Roberts Week 1

1. Introduction:Ā Hi, my name’s Haley Roberts and I’m a first-year environmental science major. I’m from Bowling Green, Ohio, which is just under 2 hours North of here. In my free time I enjoy drawing, reading, camping, and rollerskating. I don’t really know much about using ArcGIS, but it seems like a valuable skill to have in an environmental science profession, so I’m excited to learn more about it.

2. Schuurman:Ā The first thing that stood out to me in the reading was how widespread the use of GIS is. It definitely made me rethink what I thought I knew about GIS- I wouldn’t have even considered it as something that could be applied to police training or organ donation. I think it’s really interesting how the concept of GIS was initially expressed with layered tracing paper in the ’60s. Even though this makes sense, I always associated GIS as a very modern concept used on computers with special software, so hearing that GIS dates back about 60 years was shocking. Reading about the overall timeline and evolution of GIS was also fascinating. Comparing the image in the reading of one of the first computerized GIS images to what modern technology is capable of makes me in awe of the long strides that we’ve come in technological advancement. I liked how the reading compared GIS’s impact on the quantitative revolution to the calculator’s impact on mathematics. This seems to emphasize how much more we are capable of now that we have technology that can do tasks nearly instantaneously when they used to take weeks to years. The fact that GIS is known for its ability to provide a very visual demonstration of data is neat, especially as someone who is a very visual learner like myself. After the reading I can understand just how much GIS impacts people even outside the academic communities that use it the most frequently (ex. farming and consuming farmed goods, taxes, and other uses of GIS apply to the general public). The reading also helped me realize that I’ve used GIS concepts before in other classes like CNX100 or even for personal research, I just didn’t recognize it for what it was at the time.

3. Applications:Ā One of the applications of GIS that I kept seeing was to use it for natural disaster management. One of the examples of this that I found the most intriguing was using it to map power outages caused by hurricanes. Especially in a time where storms are, on average, steadily increasing in intensity, using GIS to brace for power outages and recognize which areas as the most frequently impacted seems like it could of great importance.

https://appliedsciences.nasa.gov/our-impact/story/evolving-gis-technologies-advance-disaster-management

Another application of GIS would be to map the movement patterns of certain animals. This article chooses to look at a species of frog in California, but despite being an older article I think a lot of the methods could still be applicable today. I could see using GIS in a similar manner to monitor the movement of endangered species or to observe whether or not a factor such as a wildfire, deforestation, or global warming impacted a species’ movement patterns.

https://scholarworks.calstate.edu/downloads/xs55mf25c

Miller Week 1

Hello, my name is Evan Miller. I am a senior, and my major is Zoology. I run both cross country and track and field here at OWU. I also have a passion for birds, as I want to pursue conservation work in the field of ornithology down the road.

Honestly, I never heard of GIS until a friend of my recommended the class to me. Knowing that I enjoy looking at certain maps, I am shocked about the importance and the magnitude that GIS is used, as many major companies and city planners use GIS. When I first heard of what GIS is about, I thought it was a fancy form of mapping. However, it turns out that mapping and spatial analysis are two completely different ideas. As mapping shows physical geographical features present, spatial analysis uses other data to make comparisons with the already known geographical features, which is uniquely interesting. I also had the initial thought of GIS being relatively new, due to more recent computer advances and the fact that I have never heard of GIS until recently. However, GIS has been around in the 1960s, even around the time when computers were considered a new innovation at the time. Going along with the history of GIS, the overall idea seems more complicated and controversial than I initially imagined.Ā  For instance, it seems that some view GIS as solely a quantitative tool, while others view it just as a mapping tool. Although that I currently have not used GIS, it seems that GIS uses both quantitative and mapping mechanisms to help whatever the researcher is looking for. Also, I really did not know there were differences between GIScience and systems, even though there are some distinct difference between the two.Ā  Overall, I really did not understand how much GIS is used and how widely important it is in out everyday society. For instance, GIS plays a significant role in helping agricultural yield, as it helps to provide visual data over certain fields. The fact that GIS is used in a wide variety of ways has made me more curious on how it works and how to use it.

Since I have interest in bird conservation, many bird populations have been undergoing a severe decline in their population sizes over the years. One of the ways to help understand and monitor their populations is through analyzing certain species’ migration patterns. Some researchers have used GIS to help determine more optimal sites to help collect migratory data.

https://www.esri.com/about/newsroom/arcuser/bird-migration/

Going along with conservation work, GIS can be used to help determine where to prioritize conservation for certain species. For instance, GIS can map where the specific type of habitat a particular species likes to reside in, which can help conservationist where to prioritize the protection of their suitable land.

https://www.birdconservancy.org/big-data-for-bird-conservation

Hameed Week 1

Hey there! I’m Fahad, a Computer Science and Data Analytics major. I am from Lahore, Pakistan.

It’s fascinating to see that geographers have mixed feelings about GIS, and I’m starting to get why after this intro. The impact of GIS on our modern world is huge, and being new to this field, I’m excited about how widely it can be applied. I’m still wrapping my head around the difference between spatial analysis and mapping, but it seems like there’s a lot of potential for pulling out different kinds of information. The whole concept of “black boxes” got me thinking ā€“ there are so many things in our lives that work in mysterious ways, and we just accept them without really understanding how they do what they do.

Diving into GIS applications, one area that caught my attention is the analysis of crime rates in the U.S. GIS enables the visualization and interpretation of crime data, offering valuable insights for law enforcement and policymakers. It goes beyond traditional statistical reports, providing a spatial perspective that can aid in identifying patterns, hotspots, and trends. I found a compelling map that illustrates crime rates in major U.S. cities, shedding light on the geographical distribution of criminal activities.

https://hub.arcgis.com/maps/esri::crime-in-the-united-states/explore?location=35.278608%2C-94.433020%2C3.90

Another pressing issue that GIS can address is the analysis of mass shootings in the U.S. By mapping the locations, frequency, and other relevant factors, GIS plays a crucial role in understanding the spatial dynamics of these tragic events. Such analyses can contribute to developing strategies for prevention and response. A map depicting the occurrence of mass shootings across different states serves as a stark reminder of the need for comprehensive solutions.

https://www.arcgis.com/apps/dashboards/1e728cb3660f473fb4d00db8709d4f96

Askill week 1

  1. Hello! My name is Alida Askill and I am a freshman at OWU. I plan to major in environmental science and zoology. I am from Seven Mile, OH, which is a very smallĀ town located in southwest Ohio. I have always been interested in the outdoors and wildlife conservation.Ā 

2. Before starting to read the article and look up answers on google, I didnā€™t really know much about GIS and how it works. It’s cool how one system can have so many different uses throughout the world and spectrum. Companies from starbucks to police officers are using GIS in order to get their job done. All of these different places need the GIS system to turn spatial data into digital data. I had no idea that the GIS system was being developed back in the 1960ā€™s. GIS is both focused on the hardware and software of the technology, so there’s lot of different components coming together to create GIS. A lot of the different diagrams and maps are similar to the ones I used in my stats class last year. There’s a lot of different types of areas of study that use GIS. In simple terms, GIScience answers the how questions, while GISystems answers the what questions. GIS is truly involved in our lives every single step of the way.Ā 

3. Two examples of GIS applications are within the fields of marine biology and public health. Within the field of marine biology, GIS is used to map floor beds, determine ocean currents, manage oil spills, and so much more. People can use GIS for public health by mapping where certain diseases are more common, or mapping emergencies and coordinating between different emergency responders. There is a map below put out by the CDC with help from GIS relating stroke death rates to the area of the USA. This is very helpful to see where many of the stroke patients are to better understand the disease.Ā 

Mapping marine habitats lets scientists study the relation between species and their fellow organisms. Ecosystems can be determined using this system. The map below shows the same area of Sleeping Bear Dunes located in Michigan. The same area is broken up into four different types of mapping, showing depth of water, geomorphological features, habitat segmentation, and backscatter utilities. All four of these different types of maps can be brought together to see how all of these things affect habitats and the animals that live there.Ā 


This is a link to a site describing how habitat mapping on marine sea bedsĀ  are helpful and how they are conducted.

https://www.livingoceansfoundation.org/science/habitat-mapping/


Tuttle Week 1

Hi! My name is McKenna Tuttle. I am a junior on the softball team. I am a huge UK fan and have a cat named Zeke. I am an exercise science major and environmental science minor. I am from Richmond Kentucky. I’m the oldest of four girls and two of us have moved to Ohio since graduating high school. I plan on going into physical therapy after undergrad but the environment has been a big part of my life pretty much as long as I can remember.

McKenna Tuttle

This is my introduction to GIS. I have been impressed by the magnitude with which GIS can be used. I am particularly interested in how GIScientists and GISystems can tell us very specific information on how a community is being served and whether one neighborhood is treated the same as another. Before taking this class I did not even know that GIS existed, so it was shocking to realize how quickly GIS and spatial analysis has grown since its beginning in the late 1950s. Vancouver has dedicated over 135km of pavement to bike paths that have been determined with the help of GIS. The system also keeps bikers away from heavily trafficked areas and ensures they are safe. Seeing GIS as something that can be used so broadly is interesting to me. Using GPS to determine where the blight is on a wheat field and GIS can assist the farmers in determining where the best place for the next planting of crops is such a unique tool. In the text, it talks about how the GIS application is only as good as the data being put in. I also find that very interesting because there arenā€™t a lot of spaces where something so black and white can be skewed by false data. I would be very keen to do a study on what we could falsify using slightly incorrect data and GIS applications. It says that GIS has assisted urban planning. I am invested in walkable cities and city planning that are specifically designed for patrons to lower their emissions by walking/biking. Iā€™m curious if GIS would be able to determine areas of a city that could be renovated into walkable areas only. If the information given to the system about traffic and jobs and living conditions was accurate I would see no reason that would not be available.Ā 

The first thing I looked into was GIS applications for LGBTQ+ youth resources because I know that it can be difficult for kids and teens to find help in some parts of the country and world. I asked ChatGPT to help me get familiarized with GIS and how exactly to research the topic on Google. Once on Google, I found a couple of maps with resources, but they were only in big cities like LA and New York. I had a hard time finding a nationwide map of resources. I would like to know if there is a disparity as we move into the Midwest and Bible Belt.

https://www.esri.com/about/newsroom/blog/nypd-pride-lgbtqia-resources/

Next, I looked at the Appalachian Mountains and coal mining. Iā€™m from Kentucky and obviously, coal mining is a very divisive topic there. I found some interesting maps of counties that were most affected. I think the most interesting thing I found was a timelapse of mountaintop removal from 1984 to 2022 from an aerial satellite view. Below I left a link that will take you directly to that. I am also interested in looking at the GIS application of maybe where the mountaintop removal is taking place and where jobs are in Eastern Kentucky/West Virginia.

http://appvoices.org/end-mountaintop-removal/before-after/#%20Ā 

Mulloy Week 1

Hello! My name is Gaia Mulloy. Iā€™m a freshman studying Environmental Science as my major. Iā€™m from a small rural town outside Cleveland, Ohio. My sister, Eva, also went to OWU and so I already knew a bit about the town and professors. Iā€™m a big music nerd, and Iā€™ve always had a passion for the environment ever since I was young. Growing up a bike ride away from a state park certainly influenced my interests


Beginning this course, I had a slight bit of prior knowledge of GIS. My motherā€™s work involves legal zoning and she uses GIS fairly regularly at her job, so Iā€™ve heard a bit about its potential. Initially, It didnā€™t occur to me it’s possible utility, especially in the environmental fields. It is incredibly fascinating how much more diverse and useful GIS is as a tool. Itā€™s more than just a mapmaking software, itā€™s instead used as a way to apply information to maps for computation and analysis.

I didnā€™t quite understand personally how a lack of ā€œidentityā€ so to speak would ever be a problem. From what the chapter says, it really just seems like itā€™s an incredibly versatile tool that allows for putting information onto maps and conducting analysis. Another piece of software that came to mind that I think could be compared to this is Blender, which is a 3d modeling program. Itā€™s mostly used for art (3d sculpting, animation, VFX, Motion Capture, etc.), but it has a variety of applications, such as physics simulations or video editing. The reason GIS feels so different, however, is because itā€™s unique and important uses, analysis and computing, are hidden behind the face of ā€œjust another mapping software.ā€ In Blenderā€™s case, the main use (3d modeling for artistic purposes) is the main appeal of the software and itā€™s fully at the front of advertising. It makes considerably more sense that because itā€™s best features were hidden, people tended to simply prefer handmade maps.Ā 

There is something to be said about ā€œvisual intuitionā€ when it comes to analyzing data. Using oneā€™s visual intuition is obviously a step up from text, but additionally, using a program and tool that can accurately map many different factors and display them is likely considerably more useful on a digital map from something like GIS than on other types of maps. Also, having everything in one place where it’s so easily accessible and shareable seems like it was a game changer for anyone who had to work with maps.


As previously stated, my mother uses GIS at her workplace. For her job, itā€™s more about land ownership. She works in the sale and operation of retail real estate, so things like malls and shops. Having GIS as a tool for zoning and drawing those property lines allows her to clearly see what is and isnā€™t under certain peopleā€™s control. Not only this, but GIS is also a useful tool for seeing certain other information about a piece of real estate. Certain factors that apply to land may make that land more or less valuable and therefore more or less desirable.Ā 


Hereā€™s a web GIS data extract of Delaware county, including information such as property lines and farm lots.

https://gisdata-delco.hub.arcgis.com/apps/delaware-county-gis-data-extract/explore

Hereā€™s a screenshot from this Data extract that shows property lines of commercial buildings on North Sandusky, which is the exact type of work my mother deals with.

A topic I studied last semester was Green Infrastructure for stormwater management. In order to decipher the locations of things like Rain Gardens or storm sewers, city planners needed to study the land and map out the locations of those items. Here is an example of green infrastructure mapped in an area of Washington DC.

https://owugis.maps.arcgis.com/apps/mapviewer/index.html?layers=b1ae7b7b110447c3b452d9cacffeed36

https://www.sciencedirect.com/science/article/pii/S187802961200309X

Hornacek Week 1

My name is Charlie Hornacek, I am a junior, studying environmental science and a minor in zoology. I enjoy cooking, playing football, and enjoying time with friends.Ā I took this course as I thought it would be able to help have better understanding of then environment and give me good experience for later in my career as I would love to work as a park ranger or in the national parks.Ā 

Ā As someone who is new to the GIS system , I found the information presented inĀ  “Introducing the Identities of GIS”Ā  to be useful in establishing a foundation for further learning. The various identities of GIS, including GIScience and GISystems, were explained in detail, making it easier for me to understand the different aspects of GIS technology. I also found it interesting to learn about the history of GIS and everything that was involved with its development. One of the more informativeĀ  sections for me was the discussion on the importance of visualization in GIS analysis. Understanding the relevance of visual display and its ability to help me reach conclusions about factors affecting different cases. I had never really considered how a visual representation of geographic information could significantly impact decision making. The distinction between GIScience and GISystems was also helpful in clarifying the roles of each in GIS analysis. Making this clear is helpful for someone stating out fresh trying to learn.

The First topic I was interested in was the population of gray wolves in the United States as I have done a research project over the group of wolves at the Columbus Zoo which gave me a better understanding and a valued interest in this animal. So I was wondering if you could track the progress of the animals in the wild as this is a recovering species in the United States.Ā 

https://www.arcgis.com/home/item.html?id=da949c568f7a497d9ac2f4196f262e4aĀ 


          Download

The second topic I thought was interesting is invasive species as their is so many and is such a broad topic you have plants, animals, fungus I was wondering how gis could be used to maybe interpret the movements of these animals and use it to predict and stop the invasive species before they could get to a new environment.Ā 

https://pubs.usgs.gov/publication/70176086Ā Ā 


Katterhenrich Week 1

My name is Auzlynd Katterhenrich, I am a junior, studying environmental science and biology. I love to do outdoorsy stuff so hiking, camping, and gardening. The picture below is me and my sister, Piper!

Ā 

I thought the reading as an introduction to GIS was beneficial, It explained GIS as a useful tool to visualize data, conveying a more easily interpreted feel for a landscape as opposed to a data table. It was helpful to see how the text distinguished GISystems and GIScience, which was new to me. It explained GISystems as the use of processes like classification, digital encoding, spatial analysis, and output into software which is different from GIScience which gives theoretical bases and justifies the way the process is executed. I also thought it was interesting when the issue of categorization of spatial data was brought up. That is a good point because depending on what boundaries one is trying to create between objects or even resources, there are always grey areas or ā€œfuzzy boundariesā€ that need to be represented visually. In the final pages of the reading, I found that learning about all the different ways GIS can be used and who uses it was valuable. Specifically, a concept that stood out to me was ā€œprecision farmingā€. This farming management concept is based on improving crop yields by responding to the crops’ variability. I think an effective way to accomplish this is through the use of GIS to visualize ideal locations for future farming through various layers like soil type, soil chemistry, wheat variety, pesticide load, and irrigation information. The use of GIS in this area can model the various factors that play a role in crop yield. Overall I found it helpful to know exactly what GIS is, how it began, what it does, and how it is used today.Ā 

I first wanted to see how GIS could be applied in missionary work and outreach and I was able to find an article called, Geographic information systems and the spiritual dimension of health: a short position paper, by Maged N Kamel Boulos. This article stated that “GIS are ideal tools for improving and coordinating the integration of the health (physical), social, and spiritual/ pastoral dimensions of individual and community careā€.Ā 

Secondly, I was curious about how GIS could be applied in mapping soil erosion. I found that it could be used in erosion risk mapping to create maps that identify areas prone to soil erosion based on various factors. I found an article that looked at soil erosion in Africa that gave this map showing the Grid surface of the Keiskamma catchment showing the spatial distribution of the rainfall erosivity factor.