Robinson Week 1

*Have completed what was required for the week.*

My name is Darren Robinson, a new Ohio Wesleyan University student starting my first semester here. I transferred from Columbus State Community College after completing the Associate of Science Program in May of this year. One of my favorite things to do is to learn. This can take the form of reading books, watching informational YouTube videos, and my all-time favorite: going to museums. More specifically, natural history or historical museums!

In this mid-semester course, users will focus on ArcGIS Online. In which, I have used it before, but not extensively.Looking around, My Profile is your run of the mill profile and account settings. Forums and blogs are a more community centric medium, like Reddit or Twitter. Before really diving in, it’s important to know what you are getting yourself into. ArcGIS Online has a Get Started page that provides an overview of the platform, information on account creation, and how to work within the online application. Most, if not all, of the material when it comes to working with maps or scenes, content, and data has been mentioned previously in GEOG 291. ArcGIS Online offers training courses for a variety of things. This course requires us to take the Basic Online course. Teaching users the fundamental aspects and what those can potentially offer. Overall, this course was very useful and showed us how to navigate the platform.

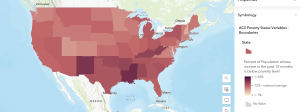
This cloud based software as a service platform can display various things. For example, it could show the percentage of people considered in poverty. Using varying shades of red from dark to light to represent high and low percentages, respectively.

Source: “ACS Poverty Status Variables – Boundaries.” (https://webgis.dor.wa.gov/portal/home/item.html?id=0e468b75bca545ee8dc4b039cbb5aff6&sublayer=0)

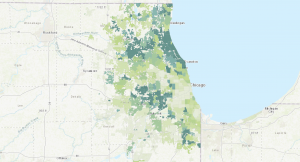
Another use case could be to show the cover of tree canopy in a given area. Using varying shades of green from dark to light to represent high and low coverages, respectively.

Source: “Community Tree Canopy Summaries” , The Morton Arboretum (https://mortonarb.org/plant-and-protect/chicago-region-trees-initiative/community-tree-canopy-summaries/)

Dahlstrom Week 1

*I reviewed the course syllabus and schedule to complete the GEOG 292 Quiz. I also have access to an OWU ArcGIS Online account from GEOG 291.*

Hello! My name is Emma Dahlstrom and I am from Lexington, Kentucky. I am a sophomore this year at Ohio Wesleyan University. Currently, I am a declared Environmental Science Major and intend on eventually double majoring in zoology. Although I do not know exactly what I would like to pursue after school, I have always been interested in working in the field of conservation. I am taking GEOG 292 because I am interested in learning more about GIS after taking GEOG 291. Outside of my classes, I am on the university’s softball team and a member of Women In Stem.

Comments On ArcGIS Online:

  • If I ever get stuck when mapping with ArcGIS Online, the training tab would be a good place for a refresher on the basic map making skills of the program. The training tab includes a variety of web courses and even has an area where you can request to talk with a training expert to answer any questions you might have.
  • The help tab will also be useful for any of my ArcGIS Online needs. It allows you to look up a variety of things dealing with GIS and can filter the results that will be most beneficial to you. I feel like it serves as a search engine that covers all the different tabs available in my account.

Comments on Get Started: What is ArcGIS Online:

  • ArcGIS Online has everything you need to create web maps, 3D web scenes, web apps, and notebooks. 3D web scenes allow you to visualize and analyze scenes that present geographical information in an interactive 3D environment. Web apps help you interact with maps and data in your organization. Web notebooks are the place for data analysis. Through notebooks, you can perform an analysis, automate workflows, and immediately visualize data and analysis results in geographic context.
  • In the working with maps section, the article introduces us to a variety of basic navigation tools and components of the different possible map characteristics. This included the basic tutorial of how to use the map viewer, a legend, pop-ups, time maps, floor-aware maps, directions, measurements, and locations.

Comments Web Course:

  • ArcGIS Online uses the software-as-a-service (SAAS) model. The SAAS model allows users to connect to and use cloud-based apps, like ArcGIS Online, over the internet.
  • I learned a lot about the sharing aspects of ArcGIS Online from this tutorial. The different methods of sharing include private, group, organization, and public. I also learned about which method of sharing is best for different situations.
Interesting Online Trainings: Visualizing Data Using Charts in ArcGIS Pro, Forest-Based Classification and Regression Analysis Using ArcGIS Pro

Application 1
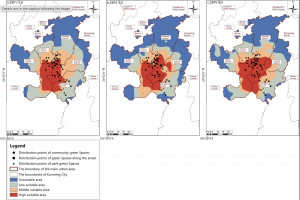
This application identifies areas of habitat stability and priority conservation zones for butterflies. Since the diversity of butterfly communities and their interactions with plants are highly sensitive to environmental change, human activity has caused a drastic decline in many species of butterflies. This is harmful to ecosystem health because without their presence, many plants would not be pollinated. To address this issue, researchers used GIS to map priority zones of habitat conservation for butterflies. This map shows the distribution of suitable habitat areas from 2021 to 2040.

Zhang, Xiaoli, et al. “Spatiotemporal Prediction of Ideal Butterfly Habitats in Kun‐Ming’s Urban Green Areas: Enabled by Maxent and ArcGIS.” Ecology and Evolution [HOBOKEN], vol. 15, no. 10, no. 72300, Oct. 2025, https://doi.org/10.1002/ece3.72300.

Application 2

This application evaluated manatee sightings and mortalities with the intention of changing the Manatee Protection Plan to better suit their movement patterns. In the area of this study, manatee mortality from boating incidents were not declining and the restrictions set to protect them were not being followed. To address this issue, the researchers used GIS to compare manatee trends in relation to vessel traffic. From this map, they concluded that the manatees were being harmed by both non compliant speeding vessels and high traffic. This allowed them to make revisions to the Manatee Protection Plan to better serve the manatees and the people living in the area.

Agosto, Ines. “Using Geographical Information Systems (GIS) to evaluate manatee protection and management in Miami Dade County.” Miami, 1 Apr. 2019, scholarship.miami.edu/esploro/outputs/report/Using-Geographical-Information-Systems-GIS-to/991031447688302976.
Boldman Week 1

My name is Mia Boldman, and I am currently a junior at Ohio Wesleyan University, majoring in Zoology and Environmental Science. I am interested in conservation, particularly within national parks. I believe that GEOG 292 will grow my understanding of ArcGIS Pro and expand my knowledge of GIS. With the skills I learn in this course, I hope to take my knowledge and apply it in my career by using GIS in environmental research and conservation initiatives.

ArcGIS Online is software to analyze data, create maps, and manage information. There is a wide range of map templates, from 2D and 3D maps to creating web apps. The online portal is an easy way to share data and maps whether they are public or private. There are a multitude of tools available to analyze data, recognize patterns and understand geographic information. If I wanted to upload my own data, I can and it can be accessed in the Esri cloud accessible by others. I’ve  ArcGIS Online makes GIS more accessible and allows for collaboration to analyze, create, and manage any kind of geographic data. 

ArcGIS Online has many different resources available in one place. The Training and Help sections can be useful when learning how to use different tools or when I need help completing a task. I found that ArcGIS Online has a Community and Forums section where users can share questions and solutions. This could be helpful when I need help that I can’t figure out on my own.

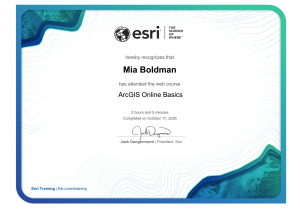
The ArcGIS Online Basics training is helpful because it introduces the main tools and features available in ArcGIS Online. It helped me learn how to create maps, add and manage layers, search for geographic information, and share maps with others. This training is useful because it explains the basic steps in a simple way and provides practice with tools that can be used for future GIS projects and assignments.


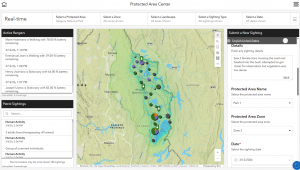
ArcGIS can be used to track and manage protected areas by creating maps that show the locations and boundaries of parks, wildlife areas, forests, and other conservation lands. It allows managers to organize information about these areas and monitor changes over time. GIS can also help track important features such as wildlife habitats, vegetation, water resources, and areas that may be affected by human activity. This information can help conservationists make better decisions about protecting natural areas, managing resources, and monitoring the health of ecosystems.

“ArcGIS Solutions: Industry-Specific GIS Configurations.” Arcgis.Com, www.arcgis.com/apps/solutions/protected-area-management. Accessed 17 Oct. 2026.

Beard Week 1

I have completed the GEOG 292 Quiz for Week 1

Hello! My name is Payton Beard, and I am a junior from Cincinnati, Ohio. I am a zoology major with a chemistry and ENVS minor, hoping to either work at a zoo or become a vet. I chose to take this class, as it seemed like something interesting that also followed along with my ENVS minor. Outside of class I am a part of the soccer and softball team, so I am always busy.

While looking around the ArcGIS Online page, we could see all my past projects, which is cool, but you are also able to go into the gallery and see other projects that have been posted, which is also cool. Another cool thing is that there are a lot of links to places that can help people become better at using ArcGIS Online.


One thing that is cool about ArcGIS Online is that a lot of people can use this app for the different jobs they do. You can use this for governmental jobs, business things, science things, or even just for everyday things.

Another thing that is cool about ArcGIS Online is that it was very useful during COVID, as it was used as a tracker of the pandemic and how it was spread all around the world.

The tutorial for the ESRI was very helpful. It showed how to use the instant apps exactly. It gives  a really great in depth preview of the apps and what each one is for and exactly how to use it. The other thing that was interesting was the difference between public and private sharing options. This can be important in many ways if you are working on something just for yourself, or working on it for your boss, or working on something that you want others to add to even if you don’t know them.

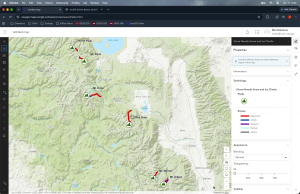
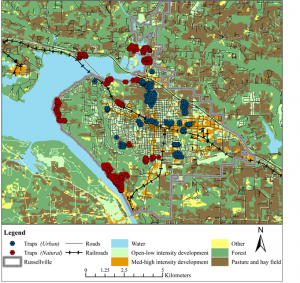
For the topic I decided to look at is at trapping locations for domestic cats in Arkansas. We can see from this map that the red symbols are traps in natural areas, and the blue symbols are traps in urban areas. We can also see other important features on these maps like developed area, forests, pastures and hay fields, and water. From this map we can see researchers used 38 trapping locations (23 in developed areas, and 15 in natural areas. This research is really good to seethe populations of feral cats in a certain area, and if their actions all are the same in 2 different types of land.