Brokaw week 2

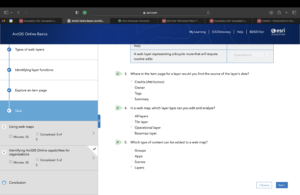
5 main types of content in Web ArcGIS

  • Data: supports data in many formats CVS, shapefiles, GPS Exchange Format, JavaScript Object Notation (GeoJSON), photos, imagery, geodatabases. 
  • Layers: Esri geospatial cloud hosts many layers including, feature layers, tilled layers, vector tiles, map image, image layers, scene layers, CSV layers, tables, and Open Geospatial Consortium, Web Map Services, web Map Tile Services, and web Feature Services. 
  • Web maps + scenes: web maps are 2D, scenes are 3D and they male up 1 or multiple layers + allow sophisticated layer configuration like style, pop-ups, access permission, and labels. 
  • Tools: Tools perform analytical functions like geocoding, routing, generating PDF files, summarizing data, finding hot spots, and analing proximity. 
  • Apps: GIS apps were made to work on mobile devices, desktops, and browsers. 

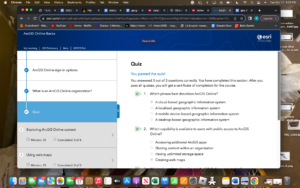
Main user types + privileges for the essential app bundle

  • Viewer→  can view items, can’t create, edit, share, or analyze items.
  • Storyteller → can create stories and express maps, can’t create other types of content.
  • Editor → can view and edit data, can’t analyze, create, or share items. 

Mapping styles 

  • Heat map → displays the relative density of points as smoothly varying sets of colors ranging from cool to hot 
  • Color and size → uses symbol color and size to show one or two numeric fields
  • Compare A to B → displays the relationship between 2 numeric fields using ratio or percentage
  • Relationship → Visualize the relationship between two number fields using bivariate choropleth mapping
  • Predominant → displays the predominant category or level of predominance among two or more fields.
  • Dot Density → uses dot density (and color) to display the distribution of one or more numeric fields. 
  • Type and Size → represents numeric fields by size and category fields by color.
  • Continuous timeline (color or size) → uses colors or sizes to represent data sequentially from new to old. 
  • Vector field → uses direction and magnitude to display imagery data. 

Include a few-sentence description of an application based on ideas from Chapters 1 & 2.

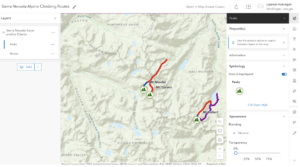
Over the summer I worked as an intern for a highway road and bridge project happening on the east side of Columbus . I would create an application to show the yard’s where material is being stored and the field offices and other storage trailers. I would make a feature of where the new road will cover and a feature for temporary roads, exits, etc. I would also add descriptions to the yards and what material is currently being stored at that location. I could also make a layer of pipe installed/ removed so it would be easier for foreman, operators, and labores to visualize so accidents can be prevented. Another feature could also be oil, gas, paint spills made on the job over the whole project just so either the city can have that information for their records and any clean up crews that might be needed after the project is finished. If we wanted information on safety around construction zones a layer could be made of accident reports and a description of the severity of the accident can be made whether that be workers or vehicle crashes. 


Week 2

Reading notes:


  • Web GIS serves as a central database with a global reach, providing a cost-effective solution for users. Its primary purpose is to facilitate data analysis.


  • Web GIS consists of five main types of content: data layers tools web maps + scenes and apps. 


  • Data can be used to publish web layers; web layers can be used to create web maps and web scenes; web maps and scenes and web tools can be used in apps or to create apps


In my application, I would aim to analyze the potential of a specific place of interest by visualizing job growth over time. To achieve this, utilizing relevant data, through the use of color or size, I will represent the progression from new to old job opportunities, allowing insight into the area’s economic development


Pois Week 2

Chapter 1:

Web GIS has five main types of content: data, layers, tools, web maps and scenes, and apps. 

There are different user types that have access to different app bundles and apps.

Viewer – can view items but can’t create, edit, share, or analyze items

Storyteller – Can create stories and express maps but can’t create other types of content

Editor – Can view and edit data but can’t analyze, create, or share items

Field Worker – Same as Editor

Creator – Can edit, create, share content, and do analysis

GIS Professional – Same as Creator

Insights Analyst – Same as GIS Professional

Components of GIS:

Basemap layers: Basemaps provide a reference or context for your app.

Operational layers: Operational layers are theme layers that you and other users can use and interact with. You can use existing layers from ArcGIS Online and ArcGIS Living Atlas of the World as your operational layers.

Tools: Tools perform tasks beyond mapping, including common tasks such as query, geocoding, routing, and more specialized tasks. 


Chapter 2:

Types of hosted layers 

Hosted feature layers: These layers support vector feature querying, visualization, and editing. Hosted feature layers are most appropriate for visualizing data on top of your base maps.

Hosted Web Feature Service (WFS) layers: These layers are Open Geospatial Consortium (OGC) WFS standard-compliant

Hosted tile layers: These layers support fast map visualization using a collection of pre-drawn map images or tiles.

Hosted vector tile layers: These layers reference a set of web-accessible tiles containing 2D and 3D vector content and the corresponding style for how those tiles should be drawn

Hosted Web Map Tile Service (WMTS) layers: These layers are OGC WMTS standard-compliant.

Hosted scene layers: These layers support fast map visualization of 3D data using a collection of cached tiles.

Hosted image layers: These layers can display raster data by dynamically combining various bands, and they support the dynamic analysis of raster data, such as imagery and other information captured by remote sensing devices.

Smart mapping

Heat map: Displays the relative density of points as smoothly varying sets of colors ranging from cool to hot. Available to point features only.

Color and size: Uses symbol color and size to show one or two numeric fields.

Compare a to b: Displays the relationship between two numeric fields using ratio or percentage.

Relationship: Visualizes the relationship between two number fields using bivariate choropleth mapping.

Dot density: Uses dot density (and color) to display the distribution of one or more numeric fields.

Predominant: Displays the predominant category or level of predominance among two or more fields.

Type and size: Represents numeric fields by size and category fields by color.

Continuous timeline: Uses colors or sizes to represent data sequentially from new to old.

Vector field: Uses direction and magnitude to display imagery data


I recently read about how there is a species of beetle that will likley become highly invasive in the future, so I would be curios to see if I could find data about the abundance of this species and highlight the prime locations of the most dense populations of beetles. I could do this by selecting the feature layers I wanted to display, or mabe creating a dot density map of the data.

Hollinger Week 2

Chapter 1 Notes, Comments, and Questions:

    1. Several different sharing levels
    2. Content types:
      1. Data: csv, shapefiles, geodatabases, etc.
      2. Layers: feature layers, vector layers, scene layers, etc.
      3. Web Maps and Scenes: maps are 2D, scenes are 3D
      4. Tools: analytical and processing functions
      5. Apps: mobile, brower, or desktop (provided or you can create your own)
    3. Apps come in bundles: user type determines which you can access
    4. Hosted vs. Nonhosted Feature Layers
      1. Hosted: web service based on Arc Managed data (ex: stored in Arc Cloud database)
      2. Non: connects directly to user-managed data
    5. Workflow to build web apps: data sources, desktop tools, ArcOnline/ArcEnterprise, Client Apps
    6. Data can include attachments (attachment viewer app template)
      1. I think one of my applications from week one included some version or similar feature to this template
    7. Details Page Tabs:
      1. Overview: basic metadata info
      2. Data: attribute data of hosted feature layers
      3. Visualization: change default properties (styles, filter, etc.)
      4. Usage: see usage stats over time
      5. Settings: enable editing and other related options

Chapter 2 Notes, Comments, Questions

  1. Feature Layers: most common operational layer
    1. Layer types: Hosted, Hosted Web Feature Service (WFS), Hosted Tile, Hosted Vector, Hosted Web Map Tile Service (WMTS), Hosted Scene, Hosted Image, Hosted Map Image
    2. How to publish a feature layer: create from your own data, create from existing template, create from empty feature layer and define your own fields interactively
  2. Smart Mapping: visually analyze, create and share quality maps with little technical skill
    1. Makes suggestions and preforms analysis based on your data
  3. Pop-Ups: deliver more info by clicking on location/feature 
  4. ArcGIS Arcade: write custom expressions for existing fields, not designed for writting stand alone apps
  5. Living Atlas Categories: basemaps, imagery, boundaries, people, infastructure, enviroment 
  6. StoryMaps: combine content types, blocks (any component you use to build a story), block pallette (combines blocks into an interactive menu)
    1. Special blocks 
      1. Side car: side by side reading experience
      2. Slideshow: horizontal scrolling to emphasize media
      3. Map Tour: curated set of places, guide audience through them
      4. Swipe: compare 2 maps/images
      5. Timeline: displays chronological events
  7. Express Maps:
    1. Simple, quick, lightweight maps you can make right in the storybuilder (or use existing maps)
  • Chapter 1 and 2 Application Description:
      1. My idea for my chapter 2 application is based on some project data I learned about as an intern at ODNR this summer. I will make a hosted feature layer based on the number of phosphorus-reducing projects in Ohio. This dataset is made public by ODNR (specifically H2Ohio) and contains the number of phosphorus-reducing projects in Ohio over 3 years. I will calculate growth rates and add pictures or more information about specific projects using the configure pop-ups feature. Then I would use StoryMaps and create a story about the effects of reducing phosphorus and why it’s important to do so in Ohio.

McFarland Week 2

Chapter 1:

  • There are many common uses for ArcGIS Online, but most of them revolve around the fact that it is more accessable than the desktop version of ArcGIS because it requires less computing power and has a decreased cost, so it is much easier to share data cross-platform between many different individuals.
  • The basic components of a Web GIS app are basemaps (which provide a refrence for data), operational layers (layers that can be interacted with to fit the needs of a specific project), and tools (which perform tasks “beyond mapping” including query, geocoding, routing, and other specialized tasks).
  • The tutorial was very straightforward other than some discrepencies from the book to the newer version of the actual program.

Chapter 2:

  • Smart-mapping is an interesting concept of increasing efficiency when creating maps for a plethora of different kinds of mapping styles. I wish I had this for GEOG291 lol.
  • The basic outline of using Web GIS for storytelling consists of maps, a narrative for the reader to follow, and multimedia to create an “intuitive user experience”.
  • Step 7 of 2.2 asks to select the theme “above and below” but I can only chose either above or below, so I decided to just go with above and it doesn’t quite look right compared to the maps in the book.
  • Here is the link to my final story (https://arcg.is/9XaOm)

Possible Application:

  • A possible application from these chapters could be using using a possible telemetry system for an endangered animal and creating a presentation of maps and graphs convince a committee to allocate more funding for protection in areas that are essential for these animals well-being. Honestly, this could be very useful for anyone creating a presentation that includes maps as integration of these maps is seamless using ArcGIS Online.

Brokaw week 1

Assign: Introduce yourself and indicate you did the stuff for this week. 

Hi! My name is Riley Brokaw and I’m a sophomore studying Environmental Science. I already had access to the OWU ArcGIS Online account from GEOG 291 last semester. 

Spend a few minutes poking around your account, including the icon in the upper-right corner, which takes you to your profile. Add your basic information to My Profile. Also, look at My Settings, My ESRI, Training, Community and Forums, ArcGIS Blog, and Help. Jot down two comments about what you find (for the blog entry for this Lab).

  • Some things I found while looking at my account were if you go to Community and Forums, creators can post a blog asking a question about an issue they ran into. It is cool that ESRI created a community for questions pertaining to this software.
  •  I also found in the ArcGIS Blog there are many articles on Mapping, Design and Planning that are open for anyone to read and gain more knowledge on a topic they are interested in. 

Use some ESRI resources to learn a bit about ArcGIS Online. Complete a read-through of Get Started: What Is ArcGIS Online. This should take about 30 minutes. Read through the different sections of this web page (stacked along the left of the page) and jot down two comments about what you find (for the blog entry for this Lab).

  • With a subscription to ArcGIS Online a learning community can be created with a select members for creating and exploring data all with an administrator managing/ organizing the environment. 
  • There is also a mobile app ‘ArcGIS Companion’ that makes it accessible for working out in the field. Being offline and being able to still create maps could save a lot of time for professionals. 

You also have access to ESRI courses online. Complete a free course that introduces you to ArcGIS Online.

  • I found that there are 3 different ways to add layers to a web map either ArcGIS Online, local files (use CVS or shapefiles), or sketch layers that can have descriptive information attached.  
  • After adding a data layer a neat feature ArcGIS will do is automatically add a symbol but if you decide to change it which is very easy the layer symbology will automatically update. 

  • Complete the Delaware Data Inventory (if you did not already do so in Geog 291). I completed this in GEOG 291!! 

Campbell Week 2

  • There are 5 main types of content: data,layers,tools,web maps and scenes, and apps. Data can publish web layers; web layers can create web maps and web scenes; web maps and scenes and web tools can be used in apps or to create apps. 
  • Today’s best practices suggest that a GIS app have basemaps, operational layers, and tools: Basemaps- provide reference or context to your map. You can use a 2d or 3d basemap, and most of the time you do not need to create a basemap to use one. However you are also able to create and use your own basemaps. Operational layers- these are theme layers that you and other users can use an interact with. Layers span in a range of subjects and can support maps and apps of almost every subject. Again, you do not necessarily need to create your own operational layers to use them. Tools- these perform tasks beyond mapping including query, geocoding, routing, and other specialized tasks.
  • There are 3 basic tiers in WEB architecture and the generic workflow to build web GIS apps: 1.) the data tier contains formats that range from simple CSV files to more sophisticated geodatabases. This allows you to author GIS data, maps, toolboxes, and scenes. 2.) the middle tier allows you to publish desktop resources to ArcGIS Online or ArcGIS Enterprise as web layers and tools. You can add the layers to web maps and web scenes and configures the styles and popups in these scenes. 3.) the client tier consists of various ready to use apps or custom apps. 
  • I studied abroad in Spain this past summer. I had the opportunity to visit the city of Barcelona and see many attractions. I would create an application of the places I visited in Barcelona by starting out with a basemap of the city of Barcelona, then I would create  a featured layer with geotagged photos of me in these specific locations. Next, I would add fields to the feature layer and edit the attributes so I can add descriptions and context to each location I visited. Next, I would add my feature layer into the Map Viewer to configure its style and pop-up before finally using the Attachment Viewer to transform my web map into a web app.

Gullatte week 1

Introduction: My name is Rheigna Gullatte and I am an environmental studies, geography major with a sociology minor. This is what I did this week. 

Poking around the website: 

  • I started exploring and clicked on community and forums. This is a cool little place where people can talk and post their findings about GIS related stuff. There is also a blog. When clicking my settings and my profile, it just has the basic necessities like every app or website does. 

Get Started: What is ArcGIS Online:

  • With this, you are able to create maps, apps, scenes, and even notebooks
  • With ArcGIS Online you are able to look at 2D and 3D maps and data. You can even share and collaborate with other people. It’s meant to be very accessible and you can even have this on your phone so you’re able to work in the field as well. 

Training: 

  • These are the two screenshots from basic training 
  • I learned that there are different access levels so everyone has a chance to use this software. 
  • I also learned that web scenes can show 3D geographic data
  • The other training I did was called GIS Basics. 
  • In GIS Basics, I learned that GIS is made up of five different components including hardware, software, data, people, and workflows.
  • Workflows can be used to improve efficiency by defining processes and repeatable tasks. 


Google Scholar:

  • One of my keywords was “poverty”. I found an article called, “Contraception Deserts:The Effects of Title X Rule Changes on Access to Reproductive Health Care Resources”. The article is essentially about how access to contraception has been a struggle and supported in a bipartisan way. Title X is the main funding source for affordable reproductive care and it is simply not enough causing contraception deserts. 


  • I read the article “Forest Understory Monitoring Protocols for Stanley Park Ecology Society Vancouver BC”. My keyword was “weather”. The article is about the native plants and vegetation in the forest and how they are trying to save the plants from climate change and environmental stressors. 

Other:  I was in GIS 291 so I believe I completed the Delaware date inventory and know how to navigate around this account.

McFarland Week 1

My name is Logan McFarland and I am a freshman who just finished GEOG291, so I am excited for this next GEOG!

Poking around my account:

  • When looking around the ESRI website I found myself looking at pricing for ArcGIS Pro and Wow it’s expensive! almost $800 for a professional basic bundle.
  • The training available is both interesting and very expansive covering many different kinds of topics.

Using ESRI Resources:

  • It seems like the online version of ArcGIS is more useful for sharing and analyzing maps than it is for actually creating them because creating them is more geared toward the desktop version of ArcGIS.
  • There are apps that can be used in the field that are useful for field workers who cannot take a computer out with them.

ESRI Training:

  • This course was eye opening to the many different uses of ArcGIS Online.
  • The quizzes were relatively easy and the step-by-step guide for the different sections was helpful.

Applications for ArcGIS Online:

I did a similar application for GEOG291, but instead of trout fishing areas I decided to use big game hunting areas.

This map shows all of the big game hunting areas for the state of Wyoming.

A

Another application that I found from the same organization, Trout Unlimited, was a map of the movement corridoors for pronghorn in Nevada. This is useful for both hunters and those concerned with the management of pronghorn populations, like government organizations, alike.

Hollinger Week 1

Hi! My name is Lauren Hollinger! I’m a sophomore from Canton, Ohio majoring in Data Analytics and Geography.

  • Spend a Few Minutes Poking Around Your Account (2 Comments)
      1. Something interesting I found in the My Settings tab is you can customize your units of measurement (US Standard/Metric) and set a default map viewer. This would be useful for different projects/data/locations.
      2. Some more resources I wasn’t super familiar with, but found interesting: The training tab takes you to a number of courses you can complete, the forum/community tab is a place where users can share information and ask questions, and the Blog tab takes you to a number of blog postings of different projects and even tutorials.
  • Use ESRI Resources to Learn a Bit (Get Started: What is ArcGIS Online?) (2 Comments)
      1. The ArcGIS Notebooks seemed very interesting to me. I would like to explore this interface at some point to see how Python coding and analysis can aid in GIS visualization. 
      2. Another thing I learned was about apps. You can create your own apps that will help users and yourself interact with maps and visualizations you make. You can add different content and data to these apps. There are different steps and considerations to take into account when creating an app. These include thinking about your audience, the components you want to include, and what type of app will best suit your needs. 
  • Complete Web Course: ArcGIS Online Basics (2 Comments and Pictures)
      1. I thought the apps were a very interesting component of ArcGIS Online. I hadn’t really interacted with these before and I liked how they could give viewers of your map a more digestible and interactive way to view and sort information.
      2. I also liked the different sharing levels within ArcGIS online. I like how you can keep your projects private to you and your administrators while you work on them, share between groups for more collaborative projects, and even make your projects visible to the public or everyone within your organization. I also think it’s really useful how you can create different groups within your organization and provide them with different data. This differentiation could be really useful in a workplace with a lot of different departments and jobs.
      3. Pictures:   
  • List 1 or 2 Courses that seem Interesting
      1. The lab course Collecting and Visualizing Data with ArcGIS QuickCapture seemed interesting to me. I like how it appears to be a fast and simple way to collect data in the field, which would save researchers time. 
      2. The Going Places With Spatial Analysis course also interested me. It’s a 6-week free course starting in January. It says it’s a good course for people who know “something about data analysis” and want to gain a deeper understanding of implementations of spatial data. So, I think it would be a fun course to take at some point with my data background. 
  • Look into a few GIS Application Areas
    1. One application I found interesting was from the U.S. Department of Energy’s National Energy Technology Laboratory. They did a study of the active Newberry Volcano in Oregon. As you scrolled through the information in the black panel on the left, the map to the right would change to reflect the geologic and volcanic features they were talking about. Plus, I learned that California’s Death Valley actually structurally influences this volcano’s basin, and I went there this summer so I thought that was super interesting. This was made in ArcGIS Online with the StoryMaps feature. Link to this story map: https://netl-doe.maps.arcgis.com/apps/MapSeries/index.html?appid=2259f4a750fa44e5a2827e57100309fc
  1.  
  2. 2. Another interesting application I found was the use of ArcGIS online to predict models for Natural disasters. Over the summer, my boyfriend made a connection with someone who works for FEMA in Washington, D.C. so, I got to learn about how FEMA utilizes ArcGIS for natural disaster relief, cleanup, and predictions. So, I searched for one of their maps. This one is a predictive model for a hurricane located off the coast of Mexico. The link to this ArcOnline Map: https://fema.maps.arcgis.com/apps/dashboards/aa7bd84d448c4d74ae268335162167cc 
  • Complete Delaware Data Inventory (I already completed this in 291)