McFarland Final

For my first app I created a story map with an interactive map of the Big Island Wilderness Area in the upper peninsula of Michigan. I took a trip there over the summer and created this to give a description of what the trip was like for any other fishermen considering the trip. This corresponds to the second chapter of the book on creating interactive story maps.

https://arcg.is/TOfCf

The second app that I created utilized the WebApp builder to create a 3d representation of the populations of each county in Ohio. This relates to the chapter 7 section on making 3d maps. The added bonus to it being made with the WebApp builder is that it has a cleaner presentation and can be more easily shared. Applications are broad for this app, but I made it with people who are considering moving to ohio in mind, and when moving to a new state people often take county population into account.

https://owugis.maps.arcgis.com/apps/webappviewer3d/index.html?id=ec26f7f24eed407782934ab95de1ddf9


Pois Final

For my first app, I wanted to look into StoryMaps from Chapter 3. I ended up making a story map revolving around Sanibel Island, which is where my family and I used to travel every summer. Unfortunately, the majority of the island was wiped out by Hurricane Ian, so all of the pictures included are pre-hurricane. I customized how the story looks and it was actually a lot of fun, and I set up a tour of all of my favorite places we would always visit.  I was able to see a preview of how it would look on different devices, and it was cool to personalize everything. I think it would be fun to utilize this feature for a project/presentation.

https://storymaps.arcgis.com/stories/96078b1a1a0348b7a42b9837d533e973 

For my second app, I wanted to try out the 3D web scenes. I stuck with the same location and used Sanibel Island, and I found data that revolved around one of my favorite places included in my story, which is Ding Darling Wildlife Preserve. The data revolved around various tree species within the preserve, so I applied the layer and then made the trees/plots 3D, identified the species of trees in each area, and applied the labels. It was interesting to see the variation of things that I could do with the 3D functions and the data.

https://owugis.maps.arcgis.com/home/webscene/viewer.html?webscene=1b336d4731864293b4162ad4bb11b488 


Rose Final

Rose Final:

  • My first map is a simple map showing food insecurity rates throughout the United States. One of the layers shows the rates around the country and how they vary based on shade of color. There is also a layer showing food banks around the United States through the Feeding America program, a prominent organization that aims on decreasing food insecurity throughout the country with food banks and providing proper meals and resources. This was sparked by my HHK background and my interest in public health and especially our food system. Although a very simple map one is able to see some of the hotbeds for food insecurity and whether or not they are being provided some aid from Feeding America food banks. This data allows us to analyze and try to help in the future. 

https://owugis.maps.arcgis.com/apps/mapviewer/index.html?webmap=e1cd6f06ceeb4fa0b974bf8b6e39a777

  • This app shows the MTA subway lines throughout New York City along with popular attractions throughout the city as well. Many of these attractions include highly visited Christmas attractions like the Rockefeller Christmas Tree and more. Being from New York I know first hand how crazy it can get during the holidays. The idea is to help people, mainly tourists, who are not comfortable riding the subway lines or navigating New York find their way around using the subway line and visiting attractions. This would best be fit for a mobile app that everyone can use and access on their phone with ease. 

https://owugis.maps.arcgis.com/apps/instant/notification/index.html?appid=1e0ee9b107ed47f28882b17121f7b87d

Gullatte final

I made an app based off of the first few chapters we read. I made an app that allows people looking specifically for condos in Delaware to do just that. It is interactive so it allows you to click the locations of the condos. It will tell you the name and the numbers of lots it has in total. My plan was for this to be a mobile app so people looking for condos could do it with ease. I think I turned the data into a scene and then uploaded it to the final app. 

https://owugis.maps.arcgis.com/apps/instant/3dviewer/index.html?appid=132633a1a10e4bb39714dd17acf158c5

This map is sort of an exhibit map. I used the 911 data from Delaware county to show others the heavily populated areas and if they were to build a new police station, where I would put and why. It is a neat concept and you can go through each slide that I presented and see what specific area I am talking about. This could be useful if presented in a better manner to the government if they were planning to build more police stations. 

https://owugis.maps.arcgis.com/apps/instant/exhibit/index.html?appid=67c83c5ef3c3428c88a80d9fe9287bf2

Hollinger Final

Chapters 1-4 App:

https://owugis.maps.arcgis.com/apps/instant/attachmentviewer/index.html?appid=1df466deebe8476e86a28f4c0d4ace68

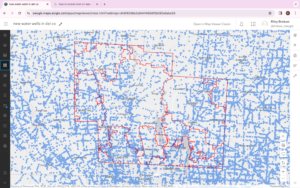
For my first app, I decided to create my idea for Chapter 1. It is very similar to the Redlands Attractions Map Tour, but I decided to do a tour of some of Ohio’s State Parks. First, I had to compile my data and create a CSV. I picked 5 state parks: Salt Fork and Mohican because I love to go camping there, Wingfoot because I worked there, Alum Creek because it’s so close to OWU, and Hocking Hills because the geology is so unique! After I decided on my parks I created columns for their longitude and latitude and filled them. Then, I made a column for a Description/Caption. I described each park based on the ODNR website information or on what I already knew about the park. I then embedded the link to the website. I then went to ODNR’s public Flickr account and found a picture for each park. I downloaded this CSV from Excel and uploaded it as a hosted feature layer. I then enabled attachment on the layer and added my images. Then I configured the symbology for the points and chose which fields to include in my popups. After that, I created an Instant App with the attachment viewer template. I chose to use an attachment-focused view instead of a map-focused view like we did in the exercise because it looked aesthetically better. After that, I published the app. I think this app would be really useful for people who are visiting the state or just looking for parks to visit!

Chapter 6-8 App:

https://owugis.maps.arcgis.com/apps/instant/slider/index.html?appid=333c829c01d04c5889cd37dacec4c463

I made this app based on the content in Chapter 6. My original idea was to do a time series on freshwater usage around the world over time. However, the time field was not working on that data, so after trying to clean and modify it I decided to just find a different dataset. This one was for a Store in the United States and it tracked their sales and where people ordered from overtime. So, I created a hosted feature layer and then configured my map. I symbolized each sale with a shopping bag and set the attributes I wanted to display in the popups. If you click on a sale it will now show things like who’s order it is, the price, the location, what they ordered, when they ordered, and shipping information. I then made sure the Time Settings were enabled for my layer. After this, I created an Instant App with the Slider Template. I customized the color of the time slider to match my sale icon and I added the legend to the map. Then, I was finished and published the app! I think this would be really useful for employees at all levels of this business to see what type of products are selling, where they are selling to, when they are selling, and for packaging and shipping items.

Here is the link to the store data I used: https://www.kaggle.com/datasets/blurredmachine/superstore-time-series-dataset/


Brokaw final

https://owugis.maps.arcgis.com/apps/mapviewer/index.html?webmap=d48f82d6a2e844f4958f5b265a9abe55

For my first application I created a map of Delaware County, OH and the zip codes within. I then used ArcGIS online to search for all water wells in Ohio. All of the blue dots are locations of water wells sites. I feel this application would be useful seeing how many people still use a well today or are reliant on city water.  

https://owugis.maps.arcgis.com/apps/webappbuilder/index.html?id=e49e6fc8084544b3ba7ae7202b161b8

For my 2nd application I used the ArcGIS Web AppBuilder to display an interactive web page display of Ohio and all oil and gas fields. Using the App builder and this theme you can search for an address or place, find the legend, filter, and also have directions from one location to another. I think an application like this would be useful for having to visit multiple locations in a short period of time.  The blue dot is  your current location and is a feature you can choose to add. 

Adjei Final

In this course

My first application was built on the skills I acquired in Chapter 2 of the smart mapping unit. Within this application, I displayed the gdp per capita for each county in Ohio. My interest in economics fueled my choice of this specific data set.

https://owugis.maps.arcgis.com/home/item.html?id=c2ac9bf71d7c403982eb222dfd6c2fea

My second app was built upon the skills I learned in the previous chapter on web scenes. I created a dynamic 3D map that visualized the growth of wholesale versus retail trade specifically within the state of Ohio.

https://owugis.maps.arcgis.com/home/item.html?id=5ab7f3709fbf44999b1a86d0a83b820b

Campbell Week 7-8 (Final)

For the two apps I created I came up with my own data. The first, I used StoryMap to take viewers through my travels in Barcelona, Spain. The map has 8 different locations pinned, and for each location there is a picture and description corresponding to what was done/seen at that spot. The locations are in chronological order to when I visited them, and so if you scroll through the images or click on a number, it will take you to where I was located and what happened in that spot. I also have a line connecting all of the locations so viewers can more easily see the distance travelled and which order the locations were visited. To create this app, I used the Online Atlas to get a map of earth, then I zoomed into  Barcelona and locked that location so the map will stay in that spot. I then selected to pin different locations and added the pictures and descriptions to each location I created. This was a pretty straight forward process and I did not have a hard time creating this. I actually found it fun to do. This app corresponds to the second chapter of the GIS book. I’ve included images and a link to the app below.

The second app I created was a 3D viewer of the student body populations at each university in Ohio. To do this I first created a web scene with a BaseMap featuring Ohio, then I used ArcGIS online and found a layer to add that included all Ohio Universities with their student body populations. Next, I changed the layer style to show a 3D count of the student body population of each college. You can individually click on each university to get the each number, or you can look at the bars and see which schools have the highest populations. The schools with the highest number of students will have the tallest bars with cooler or blue toned colors, and schools with less students will have smaller bars with warmer toned colors. I then used an Instant App to convert the scene into a 3D viewer Web App. I also found this process pretty straight forward. This app corresponds to chapter 7 in the book. I have included a few pictures of the app and a link below.

https://owugis.maps.arcgis.com/apps/instant/3dviewer/index.html?appid=c81f529af9954cf69f29f117af350e95

https://storymaps.arcgis.com/stories/7bf9546d573a479dbb52d2eb847222ad