The takeaway is, quite simply, that you can get ahead and even complete Geog 292 early, and have it off your plate to focus on your other classes. Pro tip!
Geography 292: Geospatial Analysis with Web GIS
Module 2: 10/19/2026 - 12/11/2026, OWU Environment & Sustainability
The takeaway is, quite simply, that you can get ahead and even complete Geog 292 early, and have it off your plate to focus on your other classes. Pro tip!
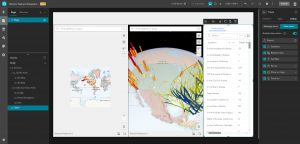
App 1: Story App
https://storymaps.arcgis.com/stories/55108ead79bc42979a28e6dfd510a0b9
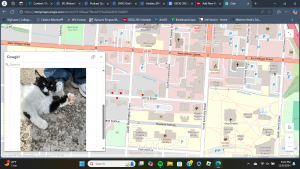
For my first application, I collected the locations of cats around the campus and immediate area- as well as some other cats that I wanted to showcase not limited to this area- in order to create a map. Clicking on the points provides brief descriptions of each cat including if they are outdoors, can be pet, and a picture or two of them. From that point, I created a story app, called “Delaware Cats: and other notable felines,” where users can interact with my map and learn a bit about the risks of allowing pet cats to freely roam outdoors such as contracting diseases, fighting, cars, etc. I also provided a video where users can learn about spaying and neutering cats since feral cat colonies are an issue in many areas- including Delaware- and spaying and neutering improves the animal’s quality of life. Then, I concluded with a couple of image galleries of my cats alongside a very old picture of me and my old cat Snoopy.
App 2: Instant App
https://owugis.maps.arcgis.com/apps/instant/3dviewer/index.html?appid=ac103aa3dd7b42af91bd020ab6386692
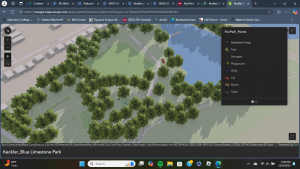
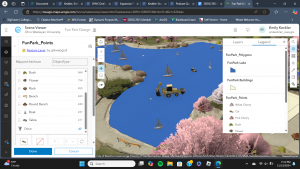
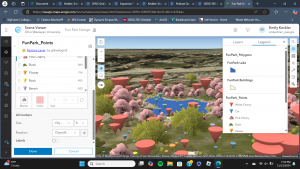
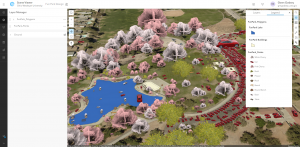
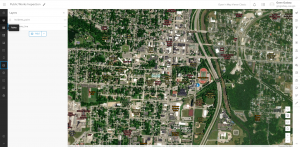
For my second application, I created an Instant App of my 3D Web Scene of the Blue Limestone Park. I added trees, cars, swings, benches, a table, and other playground structures using the fun park layer from the seventh chapter. Unfortunately, the models would not cooperate with me enough to rotate, so everything is facing the same direction. In addition to that, the sizes of the trees are misleading- many appear much larger on the map than they do in reality. Regardless, this scene can be used to gather an idea of what the park is like and the amenities that it has to offer visitors.
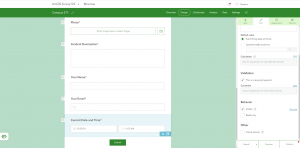
Application 1: https://arcg.is/1GibeH0
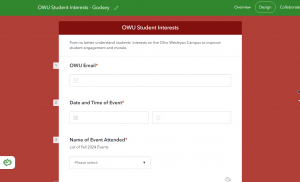
For the final project, I created a smart Survey123 form to better understand students’ interests on the Ohio Wesleyan Campus and improve student engagement and morale. The survey had 7-8 questions about the students and the events they attended. The first question prompts the student to enter their OWU email address to ensure the results come from currently enrolled students. The second question asks for the date and time of the event they attended to make sure the event was real and registered. I then added a list of OWU’s events in the fall of 2024, which could be updated for every semester and year. I also included another option for fraternities/sororities/club events that only appears when selecting other. For example, if selecting other under event attended, the student will be prompted to choose the type of event (fraternity event, sorority event, academic event, cultural event, special interest event, etc.), which will then show a list of every club in each section (ex. under cultural events it lists all the cultural clubs such as horizons which host culture fest). Then, the student is prompted with four questions regarding the event (how they heard about it, what they liked/disliked, and comments/suggestions).
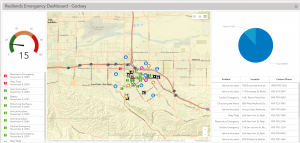
Application 2: https://www.arcgis.com/apps/dashboards/0f775368e70445489d77f1b88dbf14cf
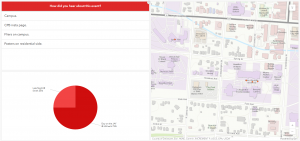
I created a dashboard app for the second application to monitor the responses to the OWU Student Interest Survey123. The dashboard has several features emphasizing important information, including location, event attended, and how the students heard about this event. The main location feature includes a map with the responses’ locations, demonstrating where the most popular events are located on campus. I also created a table to display how the students hear about the events, highlighting the most effective way to reach the student body and get the word out about stuff happening on campus. The final feature I’ve added is a pie chart that sorts the responses into the events attended to understand the most popular events.
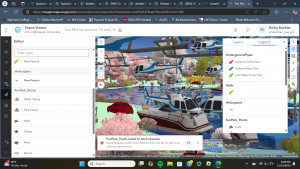
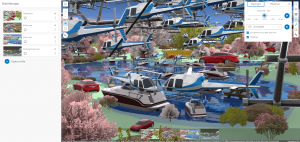
When I got onto ArcGIS, I was notified of a new update- how exciting! Chapter 7 was by far the most fun chapter to interact with. I greatly preferred working with 3D in this chapter compared to in the previous chapters. Apparently, you can even make clouds in GIS- which sounds like a fun detail to include when looking at architecture in an area with frequent rain and overcast. Throughout the tutorials, I found myself enjoying trying out different object symbols within the Fun Park. There were cars- represented as backhoes in my scene- in the lake and other peculiar places; this was also the case with the boats. That was a very weird detail. I could not locate “Elevation Mode” while I was completing the tutorial, so I just went on without it. It is a nice feature that the Fun Park scene used for the latter two tutorials can be updated by anyone, but the scene became very messy. My laptop’s performance dropped so significantly from all of the objects, and error messages were popping up about the scene’s server. I also could not locate the tools within the Analysis section for the final section of the Tutorial. Once I reached that point, I ended the chapter.
A final project idea that I have could be to map trees, benches, plants, etc. around the residential or academic sides of campus to create a 3D web scene. Another potential idea would be to map out the locations of public benches and other amenities at the Blue Limestone Park just a short walk from Sanborn. Seeing where benches and other amenities are- or are not- can be insightful as to accommodations that the city makes to be accessible to people who may feel the need to sit or activities that are available at this park.
Chapter 7: 3D Web Scenes
The 3D world has four advanced forms: extended reality (XR), virtual reality (VR), augmented reality (AR), and mixed reality (MR) – all of these make GIS more immersive and helpful to users. In ArcGIS, 3D web maps are named web scenes or 3D scenes, giving users several advantages over 2D maps, such as storytelling, urban planning, architectural design, and filmmaking. Web scenes can contain multiple layers grouped into photorealistic and cartographic categories. Photorealistic layers aim to re-create reality through photos and texture layers. Cartographic layers use attribute symbols to display physical, abstract, or invisible features (population density, flight paths, zoning laws, etc.). Scenes have four main types of elements, surfaces, features, textures, and atmospheric effects, and include the following types: 3D object scene layers, building scene layers (overviews, disciplines, category layers, and filters), integrated mesh scene layers, point cloud scene layers, point scene layers, and voxel scene layers. Scene Viewer, ArcGIS Pro, and CityEngine are primarily used to create web scenes that, once published, can be viewed in commercial-off-the-shelf client apps and custom client apps developed through ArcGIS API. ArcGIS Urban allows users to integrate 3D mapping with urban planning and BIM to create, manage, edit, and display plans, projects, indicators, and ideas.
Application Idea: Create a 3D web scene of OWU’s campus, specifically on the Jay.
Chapter 6: Spatiotemporal Data and Real-time GIS
Real-time GIS handles objects and events that move, appear, and change throughout time. Real-time data needs real-time GIS to locate/track targets and store, manage, search, display, and analyze data. Spatiotemporal data comes from various sources and can be categorized into the following groups: moving, discrete, stationary, and change. The key terms to know and understand while working with spatiotemporal data are: time measurement systems (units), time reference systems (time zones/daylight savings), time representations (arrangement of date/time), and temporal resolution (time interval of sampled events). IoT refers to the network of physical objects (various devices, airplanes, taxis, bicycles, lights, sprinklers, etc.) embedded with sensors and network connectivity that allow these objects to collect/exchange data. ERSI’s geospatial cloud provides users with ArcGIS Velocity and ArcGIS GeoEvent Server with real-time GIS. Both can meet the requirements to collect, process, and store high-volume and high-velocity real-time data generated by IoT. ArcGIS Velocity and GeoEvent Server share similar basic components: ingest, process, and outputs. However, ArcGIS is a relatively new real-time GIS product and introduces new types of items to ArcGIS: feed items, real-time analytics items, and big data analytic items.
Application Idea: Create a dashboard app to monitor the smart Survey123 form to better understand students’ interests on the Ohio Wesleyan Campus.
Chapter 3: ArcGIS Experience Builder
ArcGIS Experience Builder allows users to create layouts, content, and widgets to interact with 2D and 3D data based on ArcGIS Online, ArcGIS Enterprise, HTML5, and ArcGIS API for JavaScript technologies. Web apps created using Experience Builder are called web experiences, the steps include: choosing a premade template/starting from scratch, selecting a theme, adding source data, refining layouts for devices, and finally saving, previewing, publishing, and sharing the web experience. Basic widgets perform as app tools including map, legend, layers, query, filter, edit, chart, elevation, profile, survey, and more. Layout widgets are containers that help keep widgets organized on users pages/windows including sections, columns, rows, panels, sidebars, and more. Widgets have two action categories: message and data actions. Message actions listen to triggers and in turn perform actions automatically, these can be sorted into three components: triggers, targets, and actions. Data actions have an action button that allow users to select from a list of actions to perform.
Chapter 4: Mobile GIS
Mobile GIS has a number of features that provide advantages over the traditional desktop GIS: mobility, location, ease of data, near-real-time information, large volume of users, and versatile means of communication. Mobile GIS is accessible on mobile devices (smartphones, tablets), mobile operating systems (android, iOS), wireless communication technologies (bluetooth, Wi-Fi), and positioning systems (GPS, IPS). Owners of hosted feature layers/administrators in the organization can control various settings: add, update, delete features. Mobile app development includes the following approaches: browser-based, native-based, and hybrid-based. A relatively new product is ArcGIS Field Maps, which allows users to plan, track, understand, and capture data related to phases of field operations.
Application Idea: Create a smart Survey123 form to better understand students’ interests on the Ohio Wesleyan Campus to improve student engagement and morale.
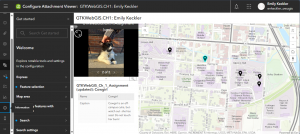
Chapter One was very informative and helped me in getting more intimate with ArcGIS. It developed the significance of GIS as a whole in being used as an accessible way to share information across the globe. I did need a bit of outside help with figuring out how my laptop works with uploading excel files and C: drives, but that was my most significant hurdle in navigating Chapter One’s tutorial. Turning a map into an Attachment Viewer App was far more straightforward than I had initially thought it would be. After completing the tutorial, I did go ahead and make a little app myself to help reinforce everything I had learned thus far. Once again, uploading excel files and C: drives were a battle, but I came, I saw, and I conquered.
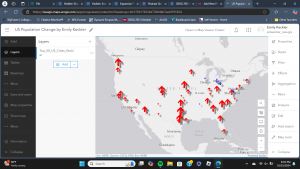
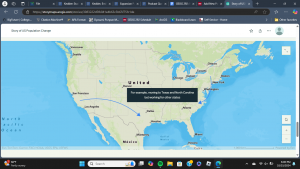
Chapter Two was a jump from the preceding chapter in the amount of content that it covered- especially within its tutorials. The emphasis on creating a story web app following a “Who, What, When, Where, Why” template was reminiscent of writing summaries in first and second grade. Though, that model does hold up in a more nuanced and complex application as GIS. I did come across an issue with renaming something, but I let it be and had an opportunity later to rename. There were also a few details that had changed from the tutorial (ie. there was no “subheading” or “large paragraph” within the Story Map App Launcher- just “heading” and “paragraph”), but I persevered. I took a decent amount of time going through everything to make sure that it was right, so I would say that everything went smoothly on my end. Something that I noticed in the book was that, when directed to draw an arrow from New York to North Carolina, the book had drawn the arrow to Virginia instead of North Carolina, so that must have gotten past the editing team.
An idea that I have for an application from the content of Chapters One and Two is to survey around campus as well as the Downtown Delaware area for different outdoor cats. This could be a mix of quantitative data for the locations of different cats as well as qualitative data (ie. if the cat is approachable,etc.). I could send a survey to people willing to share information on the cats that they have spotted in addition to venturing around to take photos of and mark the locations/addresses of where different outside cats can be found. Another possible idea would be to document the different types of flora that can be found on campus- specifically bushes and flowers.
Chapter 1: Get Started with Web GIS
Web GIS combines the web and geographic information systems (GIS). It allows users to interact with GIS apps and access information globally. Web GIS use has recently increased throughout various organizations, including government agencies, businesses, science research, and daily uses. Web GIS can be applied to several applications, including mapping/visualization, data management, field mobility, monitoring, analytics, design/planning, decision support, constituent engagement, and sharing/collaboration. Web GIS elements include users, groups, content items, and metadata. Web GIS’s main content items are data, layers, tools, web maps, scenes, and apps. Apps are what users are directly interacting with while using Web GIS and include configurable apps, ArcGIS StoryMaps stories, mobile apps, app builders, and more. The components of a Web GIS app include basemaps, operational layers, and tools. Basemaps provide a reference or context for an app; a wide variety of basemaps are provided, but users can also create their own. Operational layers are theme layers that can be interacted with. Finally, tools can perform query, geocoding, routing, and more tasks to solve spatial problems.
Chapter 2: Smart Mapping and Storytelling with GIS
Feature layers are the most common type of operational layers and are essentially web services that can be reused in many web maps, scenes, and apps. Hosted layers are the most widely used operational layer published to the Esri geospatial cloud; they include hosted feature layers, hosted web feature service (WFS) layers, hosted tile layers, hosted vector tile layers, hosted web map tile service (WMTS) layers, hosted scene layers, hosted image layers, and hosted map image layers. Hosted feature layers can be published in the following ways: create a feature layer from a user’s data, create a feature layer from an existing template, and create an empty feature layer and define your fields interactively. Smart mapping allows users to visually analyze, create, and share professional-quality maps without the need for extensive cartographic or software skills. Smart-mapping styles include heat maps, color/size, comparison of two fields, relationship between two fields, dot density, predominant, type/size, continuous timeline (color/size), and vector field. ArcGIS Living Atlas allows users to find operational and basemap layers to use in projects. The following data can be found within ArcGIS Living Atlas: basemaps, imagery, boundaries, people, infrastructure, and environment.
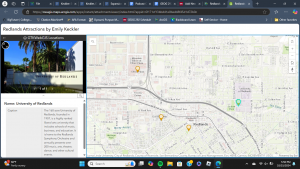
Application Idea: Based on the information I gathered from Chapters 1 and 2, my application idea is to mark buildings (dorms, dining halls, libraries) and departments (STEM buildings, history buildings, etc.) on the Ohio Wesleyan Campus using data provided by Delaware County Ohio GIS Data Hub.
