Benes, Week 3

Chapter 1: 

  • First off it was really interesting to see all the advantages of Web GIS and it seems more friendly to use than desktop GIS.this seems to be a program where you can heavily connect to various data and people to gain information and learn.I didn’t quite fully understand the information about hosted and nonhosted feature layers but it might make more sense down the line. The tutorial was a little hard for me to understand, I wasn’t able to download the files correctly. Therefore I am planning to set-up a meeting to discuss that. 

Chapter 2:

  • The beginning of this chapter talks about hosted layers more in depth which was helpful. I thought it was really cool to see the sample smart-mapping styles. I think the idea of storytelling through GIS is really cool. In the previous course we did a little storytelling but I am interested to see more components. I was struggling again to get the download correct therefore I wasn’t able to complete the tutorial. 

Shaw week 3

Chapter 1:

  • Web GIS is the combination of the web and geographic information systems.
  • The first operational GIS was developed in the 1960’s by Roger Tomlinson.
  • Web GIS is used within the government, business and science world, and even in people’s daily lives.
  • ArcGIS online is a software offering web GIS, ArcGIS.
    • With the benefits and easy to use software ArcGis online has been picked up by many governments and commercial organizations around the country. 
    • ArcGis enterprise is a web gis software product that organizations can use.
  • ArcGis online has four software components: Portal for ArcGis, ArcGis server, ArcGis data, and ArcGis web adapter. 
  • In chapter 1 the first tutorial shows you how to create a Web GIS app that introduces the points of interest (POIs) on maps.

Chapter 2:

  • Smart mapping and storytelling with GIS
  • Feature layers: the most common type of operational layers
    • Web layers are essentially web services that can be reused in many web maps, scenes, and apps.
  • This chapter mainly focused on hosted feature layers, which are the most widely used operational layers.
  • Smart mapping enables users to visually analyze, create, and share professional-quality maps.
  • Tutorial 2 will show you how to create a Web GIS app that presents the spatial patterns of populations. 


Geog 291 application:

I used the applications from chapter 1 and 2 to help me show the population in Delaware county as well as the population that was above a certain age.

Allo Week 3

Chapter 1:
I think it is very cool and important that a part of data analysis can be so visual. I know for me that this makes data more digestible and understandable. I liked the figure describing the multiple pathways and “generic workflow” for creating web apps. One thing that I think will take some getting used to is figuring out and deciding what map style will be the best to display certain information. I assume this will come with trial and error and testing out what works best with what kinds of data.
A question that came up is how do I access “Arcade?”
Tutorial 1:
This tutorial was very helpful in terms of learning how to get a map/app to look the way you want it to. This eased some of my worries about picking and choosing what style goes with what. I believe now it is really whatever looks right in the moment and it can always be changed to represent something different.
Chapter 2:
I think the ArcGIS Living Atlas is such a cool resource that really has a lot of information present in one place. It is also cool that it can be updated in a matter of minutes. The idea of storytelling through these maps and apps is such an engaging way to think about gaining information. I like the visual of Maps+Narrative+Multimedia=Story.
Tutorial 2:
I liked that this tutorial focused on the story aspect of the maps and how to cohesively present a story about the data that is both understandable and interesting. I wasn’t able to figure out how to add the curved arrows on my map, but I figured some of the other stuff out.

Both tutorials gave me examples of what the readings discussed and I thought it was very helpful. Put it all together and into practice. I believe my question about Arcade was answered in Tutorial 2. I appreciated that the tutorials came with all the data and images needed to complete it. I thought that made working through it much easier and almost seamless.

Idea:
One idea I had was (from Chapter 1) to map supermarkets in Delaware and how many average shoppers are there a week. I could use the pop-ups to describe each store and the people that shopped there. I also could use the story feature to illustrate the history of each store and indicate whether it is a chain store or a local one.

Schtucka week 3

Chapter 1: 

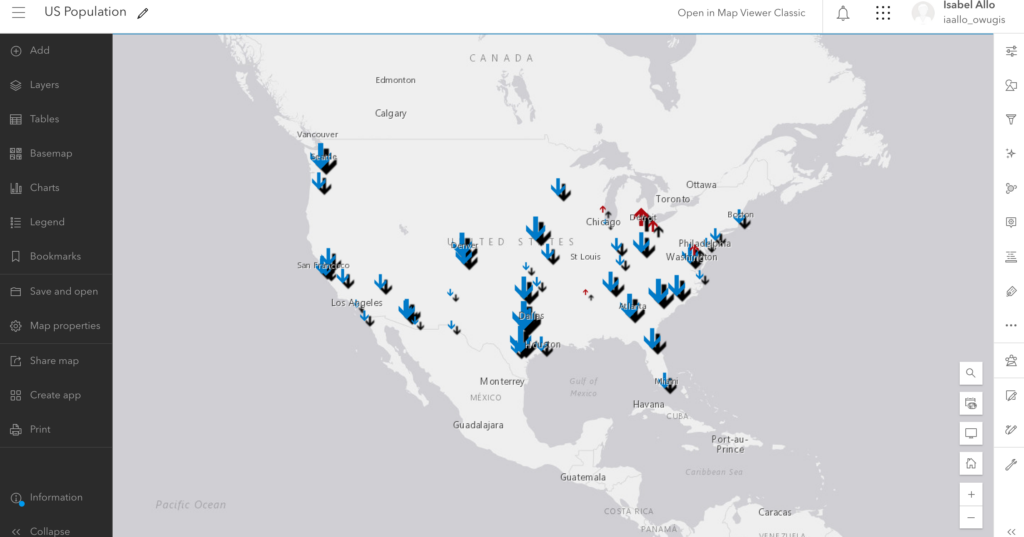
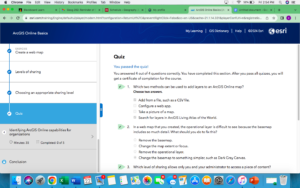
WebGIS allows for work to be done everywhere and also serves as a way for information to be accessed, essentially, instantly. I feel like WebGIS is a more evolved and user friendly version of ArcGIS. This is because WebGIS has a lot of perks compared to ArcGIS, but there are still similar aspects like creating an app/map and the terminology with that. The first perk is that it is good for sharing. WebGIS allows for your app to be seen by literally billions of people. Along with that, there are options that allow for you to select who sees your app, it can be globally or it can be within your organization. WebGIS is also easy to use. It was designed to be convenient, simply, and be able to be used without having any technical background. Another perk of WebGIS is that it is affordable. You don’t have to pay for the software itself, and there is a low cost per user per app. Conversely, in my opinion there are also a lot of similar features to ArcGIS. The most basic creation in WebGIS is an app. An app consists of a basemap, operational layers, and tools. All of those features are what is used to create a map in ArcGIS. A basemap is the very first layer of an app. It provides background information or serves as a basic point of reference. An operation layer is the different theme your apps will have. These are things like buildings, data, etc.. These serve as the interactive layer and are more likely the reason for creating the app. A tool is what is used to create an app and to do things beyond mapping itself. This can be data analyzing, customization, etc..

I could not find the “Select fields for: Locations” in the chapter 1 tutorial so I was unable to complete 1.4 

Chapter 2: 

I was not aware of how many different types of layers there are in WebGIS. In ArcGIS everything is just called a layer by our textbook, and now there are a lot of different layers. At the most basic level, there are hosted VS non hosted layers. A hoster layer becomes a hosted layer when it gets published to ArcGIS Online. ArcGIS “hosts” your layers and the data that is in them. A nonhoster layer is when your layers or data are not posted into ArcGIS online but instead are in a user-managed database. There are also a bunch of different subcategories for these layer types. For hosted layers, there are hosted feature layers, hosted web feature service (WFS) layers, hosted tile layers, hosted vector tile layers, hosted web map tile service (WMTS) layers, hoster scene layers, hosted image layers, and hosted map image layers. If you want to post a hosted layer to ArcGIS Online, there are a few ways you can do so. The first way is to create a feature layer from your own data. Your data could be a CSV file, a shapefile, a file geodatabase, or other things. To do this, you would go to ArcGIS Online Content, then click New Item, select where you want to upload your data from (IE: google drive, device, etc.). The second way to create a hosted layer is to create a feature layer from an existing template. To do this, you want to have an empty layer containing the same attribute fields with no data. To then find a template go to ArcGIS Online then go to content, new item, feature layer, and then use a template. The third way to create a hosted layer is to create an empty feature layer and define your own fields interactively. To do this, you also go to ArcGIS Online then go to content, new item, feature layer, create a blank layer, and then choose the type of geometry you need. After you create the layer, you go to the item page, data, fields, and add fields.

IDEA:

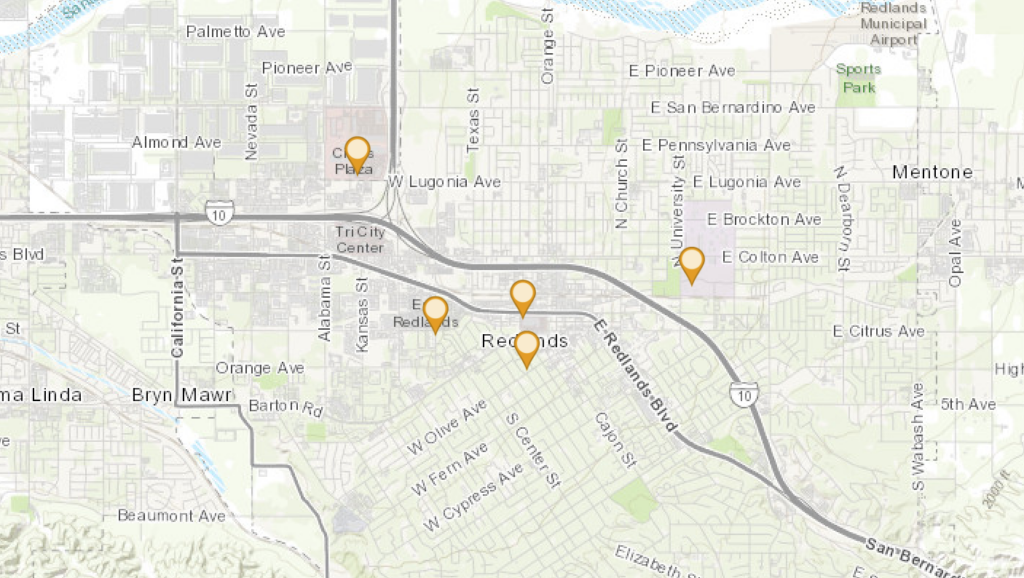
My app idea is to use the “GPS” data from the Delaware data set to make an app to educate people on the different GPS monuments in Delaware county. I would make a feature layer that symbolizes all of the monuments, then I would configure their popups to tell a little story about what each monument is and when it was founded. I would then create a pie chart consisting of the dates that each were founded to allow the viewer to compare the history of each GPS monument. I would also try to find a link that would take the viewer to an informational site saying what a GPS monument is, and maybe even an educational video. 

Quartson Week 3

This opening chapter goes over the fundamentals of Web GIS. It explores how the cloud revolutionized data storage and sharing, and how Web GIS software has evolved over time. While the chapter goes about the technical aspects of geospatial cloud capabilities, I found the historical background of Web GIS particularly interesting. Chapter 2 takes a deeper look into web app development within Web GIS. It talks about different features like feature layers. These features let you customize and style however you would like and this helps you create a pretty decent map. Something that I found really interesting was also the different type of mapping styles in chapter two. Like I have never heard of a vector field, a predominant map, dot density or comparing “A” to “B” map. I’m not gonna lie, I had a hard time trying to create an app so I will probably have to come in person to do that or I’ll probably just see if I can find some youtube videos that will show me how. Other then that though the readings were pretty fine. I found a map that showed different characteristics about the U.S population like the age groups of people who worked in different cities.  

Nagel Week 3

Or is it technically week 2? I don’t know but I’m gonna call it week 3 for simplicity. Chapters one and two are fairly interesting but also very confusing. Chapter 1 introduces the basic aspects of Web GIS, such as the ‘cloud’ for data sharing and storage, the evolution of the software (can I even call it software if its all online?), types of users, content, and apps. Now I thought 291 was painfully technical in its explanation of things but I’ll say this for the record; 292 and Web GIS takes the technical aspects of 291 and cranks it up to 100. Half the things the chapter tries to explain go directly over my head and therefore my feeble little brain fails to comprehend any of what is said. The book content tutorials are similar to the ArcGIS program at least. For the 1.3 tutorial there was no ‘community map’ as asked by the steps in the tutorial. Everything else went smoothly until attempting to create the app with which I was met with a blank screen that didn’t load a preview even after 10 minutes so not sure what’s going on there.

Chapter 2 discusses web apps further and going more into different features such as ‘feature layers’ which allow you to style and customize them in a way that fits your needs and can be used to create a ‘story’. For example, different types of ‘smart mapping’ are shown which can be utilized. The chapter also discusses the ArcGIS Atlas which if I recall correctly was used briefly in 291 but I may be mistaken. Overall the chapter discusses ‘storytelling’ which now that I think about it seems odd to discuss in this setting but I digress. In tutorial 2.3, working the attribute expressions didn’t work either as the book asked me to input a code yet there were no options to do what it was asking me to do. I have the 5th edition book so I don’t know why things aren’t working… I’ll need to sort that out next week as I can’t complete the work like this if I just keep hitting dead ends halfway through the tutorials.

An idea for a map utilizing information from chapters 1 and 2 and also using data from 291, an interactive app could be developed towards those engaging in recreational activities involving water (boating, fishing, swimming, etc) that displays the sources and spread of things such as pollution and algal or bacterial blooms using data published by whatever local government organization publishes data on said factors. This could warn water-goers of these areas and focus cleanup efforts on said areas.

Hagans Week 3

The first chapter of this book starts by explaining some of the benefits of having GIS on a web-based platform- such as increased interactions, wider access, and easy use. I also learned what HTTPS, HTML, and URL stand for (abbreviations we all use every day but probably don’t know what they actually mean). The first chapter also goes into a lot of technical explanations about the geospatial cloud capabilities- which didn’t make a ton of sense to me, but it was still interesting to see how widely available Web GIS is. It was interesting to learn about the history behind web GIS websites and how they used to be all separate before the 1990s, which made it incredibly difficult to share information with others. Once the internet and web became more sophisticated in the late 1990s, GIS applications became much easier to view, use, and share. It was also interesting to read about how Web GIS uses AI and machine learning currently. These chapters also go over some of the content involved in ArcGIS Online- most of which are similar to ArcGIS Pro, but the apps and web maps are a new concept (though we partially looked at some of these in 291). One very nice part about the GIS apps is that they don’t require any coding or programming- which makes them much more accessible to a wider range of people. The tutorials were all fairly easy- there was a bit of a learning curve finding where all of the things are located in the different toolbars since it is slightly different than what I had become so familiar with on ArcGIS Pro. I enjoyed creating the apps, and I also thought it was a good feature to have a preview of how the app would look on a phone, computer, etc. It was also fun getting to style some of the points in ways that ArcGIS Pro couldn’t. 

One idea for an app based on the techniques used in chapters 1 and 2 would be an interactive app/ web map that would be directed toward road trippers or people traveling through the US. Routes could be drawn on the map, with stops in cities or landmarks that have interactive points with information on each location. Another application of these techniques would be to show the pollution data of various cities and even show how it has changed over time by comparing current pollution data to previous recordings (using the above and below feature). This would give us an idea of what cities have strived towards decreasing their pollutants and which have increased their pollution.

Tuttle Week 1

My name is McKenna. I am a junior exercise science major environmental science minor. I took the first module earlier this semester. I am looking forward to learning more about the online version. My computer is simply too old to handle the online version, so I get the luxury of using desktop computers throughout campus.

I noticed that there is a place where I can add a profile picture and a bio. I feel like that would be overdoing it a bit as I introduced myself moments ago. The Esri Academy is really interesting. It looked like I needed an invitation. Maybe after the course I can look into getting connected and building more knowledge about GIS

It appears that ArcGIS Online is meant to work with a wider variety of people than the ArcGIS Pro that we worked on in the first module. I also noticed that there is an app. It would be cool to use the app later in the semester and connect it to our ArcGIS account. That being said, there was a whole bullet point in the article that talks about connecting the online version to Pro. I had a really hard time connecting to the online version in the first module. 

I enjoyed taking the class. It didn’t quite take me the whole two hours that I allotted for which is a relief. I thought it was really cool how we could create instant apps that make it a lot easier to share with someone. It’s a smart tool that someone created to make sure that they could pass information quickly. I thought the course itself was intuitive and easy to follow along with. I haven’t carefully read the entire syllabus, but I hope we do another training module or two before the semester is over.

I looked at nursing home evacuations versus shelter in place during hurricanes. I looked at this specifically by looking for a connection between ArcOnline and physical therapy. The researchers found that this was really the first study of its kind. They proposed continued use of GIS to establish a protocol to ensure that the most vulnerable are safe

Sakib, N., Hyer, K., Dobbs, D. et al. A GIS enhanced data analytics approach for predicting nursing home hurricane evacuation response. Health Inf Sci Syst 10, 28 (2022). https://doi.org/10.1007/s13755-022-00190-y

This second map depicts clustered sport delivery points in the five City of London Ontario planning districts. It is mapping the different hot spots of organized sports. Organized sports are a clear indication of an active individual. I looked specifically for youth sports but I think the online version might not have the layers. This paper did organized sporting events overall.

Shaw Week 1

I am Ethan Shaw, a senior from Woodland Park, New Jersey. I took the GIS 291 class last
semester so I am a bit familiar with GIS and how to operate it. I enjoyed the course's last module
and am excited to see what this one has in store.

Poking around comments:
I looked around at my profile and my esri. I am not sure what to add to my profile, I
already used it for the last class.
When accessing my ESRI I am not sure what I am looking for, it says I need to put a
code in so I will have to email the professor to navigate that.
Reading:
The reading was very easy to follow and was quite interesting when explaining how the
application is used. ArcGis online is very adamant about sharing work and collaborating as a big
part of the application. The application can also present data and maps to any group of people
and make it easy for them to understand.
Training:
The training was very easy to follow and was fun to do. The quizzes were not hard and helped
me learn a lot.

Howard Week 1

Hi, I’m Maddy Howard, and I’m from outside of Cleveland, OH. I’m a sophomore majoring in Environmental Studies and Geography, and I just took GEOG 291 so I’m interested to see what GEOG 292 is like.

Poking Around:

I’m not sure if it was the website or my laptop in general but it took me a while to load any of the options below “my profile”, especially the training portion, which is super annoying. I will see if this continues soon or if it’s truly just my laptop. (Note from a later date- OWU wifi was terrible and made it impossible to load any of the training resources)

Get Started: What is ArcGIS Online Read Through

I spent a good amount of time re-reading the explore content-view and use items section of the Get Started reading. There’s a lot of complicated parts to just looking at what you see on the website. Also, the notebook on the website seems like it would be useful but the interface, especially the edit menu, has a lot of information. Plus, I know nothing about coding so the thought of python scares me. I have a feeling that I will be referring back to this get started section a good amount of times.

Web Course: ArcGIS Online Basics

I thought this training was really helpful. It provided good insight into what this all is and what it can be used for. I found the exploring ArcGIS online content the most helpful, as I think it went into detail about the types of things included in the maps and apps. 

2 training courses that seem of interest:

Field Data Collection and Management Using ArcGIS- I didn’t think of this as a use for ArcGIS. It seems like it makes field activities more accessible to wider audiences which is really cool!

Create Smart Surveys and Forms Using ArcGIS Survey123- This is an interesting addition to all the things ArcGIS does. If you had a presentation or something this allows you to get feedback on the same website. 

GIS Application Areas Based on Keywords:

Florida Panther Telemetry- It’s really interesting seeing each panther’s activities. I looked up more about them through the Florida Fish and Wildlife Conservation Commission and had no idea that they are endangered and some sort of unknown disorder affecting them. That makes maps like these really important so you can monitor the species. 

Hurricane Harvey Damage Assessment- Natural Disasters are interesting to me, and I know ArcGIS has some resources about it, so I tried to find a map relating to it. I came across this one which shows a lot of information about building damage in Houston after the hurricane. There is actually a complete tutorial on how to get to this final result that can be replicated for other circumstances, which is a great resource.