Nagel Final Week

(Disclaimer: I still cannot get instant apps or any apps to work no matter what I try, it just ends up loading forever and ever on repeat. Waited three hours and gave up, so I just decided to redo everything in map and scene views. I can’t access any of the other apps or surveys from other classmates either, all of them either don’t load or say I don’t have permission access. I’ve been at this for hours and I yield. Dr. Krygier, you’re more than welcome to dock points for these not being true apps but at this point I’m at my wits end with this tech and its not worth the literal headache this is giving me. Hopefully this is still sufficient and gets my ideas across)

>>(‘Apps’ are linked in text)<<

App 1: 2D/3D Map

My main problem for selecting an idea from Chapters 1-4 is that this data just… wasn’t available or didn’t exist. For example, using a data layer which showed algal bloom or pollution predictive data in a certain area such as Alum Creek Lake. Said datasets did not exist. So I had to look at the web experience… and most of the data I wanted didn’t exist there either, so I had to improvise and go back to the introduction for an idea. Instead, I would try making a 2D/3D view of air traffic across the continental US… that dataset does exist but I don’t have access to it and need to install some kind of different program for ArcGIS Online to get it which I’m not doing. I could’ve done boat traffic but that data didn’t work, and there’s no way to convert a web scene into a web map so I was kinda screwed. So I had to stray from the path even more, finding two data sets which… sort of work together? Not sure what practicality it has for an ENVS setting or anything but it is in my interests. I managed to find a layer showing aircraft disasters in the 21st century and given recent events with Boeing, I thought it was fitting. Those kinds of things are also something I’m highly interested in, so this was really more for me than any of you… so sorry to disappoint on that front… assuming classmates are even reading this. I also couldn’t get the two maps to sync and transition between each other so I just ended up with a 2D and 3D map side by side, the 2D map showing a view of global air travel routes (the description doesn’t say how recent but it does say it was updated in 2023 and there’s really not any other data sets to go with that. The 3D map is semi interactive, showing the locations of aviation disasters that have occurred since 2000, the aircraft type, fatality count, etc. Yah this one just… didn’t work out how I wanted. I mean if you’re morbidly curious about horrible disasters, this one is for you?

App 2: Live Data

So I originally wanted to make a 3D view of Cleveland and use a topographical map and label some of my favorite fishing spots around the area and the stuff I’ve caught… but there’s no 3D data for Cleveland AND you can’t add labels or popups in the scene viewer which was just infuriating so I had to scrap that idea (much to my disappointment. Would’ve been a fun going away gift… maybe… I doubt any of you are going to be doing any fishing in the Cleveland area anytime soon.) Anyways, I went back to the live/real time data and had some more luck. Granted, I wanted to do air traffic but I don’t have access to those layers/files for some reason so… yah. So I went with the next best thing. My recent hyperfixation has been ships, specifically ocean liners. Unfortunately those haven’t existed since the 60s so the only data you can receive is from cargo and cruise ships. There I was thinking I could make a live data ‘app’ of ship traffic on the Great Lakes. How completely and utterly wrong I was… because that dataset doesn’t exist either. I found one dataset for real time vessel positioning since that showed up when hovering over the Great Lakes, but all the vessels displayed are in the Ohio River or in Chicago. The dataset didn’t have much of a description other than ‘real time vessel positioning in the surrounding area’. There’s a second dataset which shows the real time position of various large ships in different oceans… Yah this was a disaster.

Nagel Week 6

Chapter 7 was quite extensive in the intro but it did reintroduce 3D aspects, something which I found highly interesting during GEOG291 and is also one of my favorite aspects of GIS. There’s something about looking at it that sort of… tickles your brain? I’m not sure how else to say it. Anyways, Chapter 7 discusses the different types of 3D viewing such as extended reality (xr), virtual reality (vr), augmented reality (ar), and mixed reality (mr). I have had experience with AR and VR outside of class but that’s a different story. Chapter 7 also discusses different types of scene layers and how to create them, how to create web scenes in the scene viewer (which the tutorial goes into detail on) how to change 3D symbols in the scene viewer.

The tutorials themselves were a bit of a mixed bag. The chapter was a bit shorter than normal and went by quicker than others but it had its issues. Half the items were not where they were supposed to be and it took a significant amount of time to locate the items it wanted me to find. I’m not sure half of it was even correct as I had to guess what  half of the selected items were. I also don’t think some of the 3D web scene icons worked correctly. For starters I don’t think Tesla’s are able to drive on water and I’m also fairly certain though I could be wrong that there is a bush reaching into the stratosphere in the mountains of California. I’m also fairly certain for 7.4 that there are no helicopters flying around which are bigger than the alien ships from ‘Independence Day’. My computer was also running extremely slow during this section which hasn’t happened before. 4.5 and 4.6 both went by relatively quickly albeit with the same problems of things being severely out of proportion. The slice feature was pretty interesting to play around with though.

As for an application idea, luckily this time I have a few more ideas. Given that I am an avid angler, I could theoretically create an app which shows a 3D layout of one of my favorite areas on the water back home in Cleveland.

Nagel Week 5

The schedule says to skip Chapter 5 so I didn’t attempt the assignment/tutorial but I did still read it, albeit maybe not as in much detail as usual. Chapter 5 discusses the creation of a ‘self-managed’ or private Web GIS and the various reasons for doing so. Chapter 5 also discusses ArcGIS Enterprise, the version of the program made for private types of GIS programs. Also mentioned are ‘portal collaborations’, the differences between various tiles and features such as vector, raster, and feature tiles, and the different strategies for choosing any of the various layer types.

Chapter 6, as its title implies, discusses ‘spatiotemporal’ data, or data relating to space and time and details GIS systems which update data in real time. I’ve never heard the internet referred to as the ‘Internet of Things’ so that’s definitely interesting. Chapter 6 also discusses ‘stream layers’, how to use ArcGIS to look at real time data, and animate time-based data. As for the tutorial, looking at things such as real time traffic cams is interesting to see. It was nice to have everything going smoothly but I could only get as far in the chapter 6 tutorial to the end of 6.4 whereupon trying to tell the code to make a certain icon the color red, the arcade script code just decided it hates the color red or something and decided to stop working entirely, rendering the table completely useless. From what I could do though, I liked the idea of real time GIS.

To be honest, I’m not quite sure how I would go about making an application based on what was learned in chapter 6. Perhaps an app showing the real time flow data in streams and rivers?

Nagel Week 4

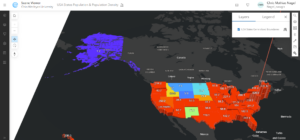
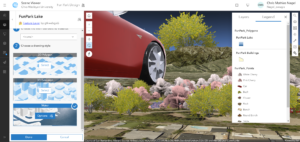
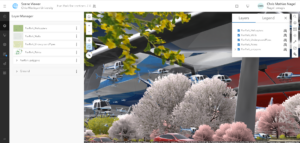
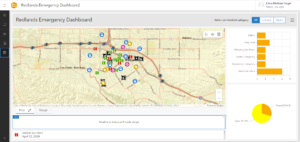
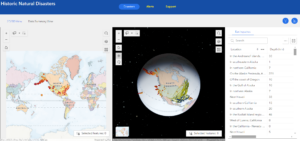
Chapter 3 introduces the ‘Experience Builder’, an ArcGIS component that allows for app to be configured with more functionality than what is typical, such as dynamic content, charting, and reporting. Chapter 3 also introduces the various terminology of the Experience Builder component. The chapter also explains the workflow for creating web apps with the Experience Builder, and how to understand widgets and their contents. Chapter 3 also explains how to configure widgets and use things such as filtering. Finally Chapter 3 discusses ‘triggers’ and ‘actions’, and how to utilize them. The Experience Builder is a multi-step process which starts by using a template or by starting from scratch. From using the Experience Builder maps can be made in 2D or 3D, and allow you to configure the various widgets, themes, layouts, and presets. The tutorial went smoother than the ones in chapter 1 and 2, but it was still a bit difficult and technical and took a while to complete. That being said, I love learning about natural disasters so this is right up my alley. Also at least this one worked and despite it being a bit difficult it did ultimately end being a little bit fun.

Chapter 4 introduces a mobile version of GIS software, the approaches to building mobile apps. collecting data, and the configuration of feature layers. I have never been a particular fan of mobile apps, something you can thank the constant spam of mobile app ads for. However, I see how mobile applications of GIS could be utilized to an advantage. A mobile system also potentially allows for more people to access the software and make data collection easier. The features listed are also compatible with numerous different operating systems, and with ArcGIS only being operable on Microsoft and Windows systems, collaboration and the sharing of data becomes easier. As for the tutorial, it had some of the same problems as tutorials 1 and 2, with serious mismatches between the book and website that made completion of 4.1 and 4.2 impossible as once again the option to add an expression was not there, or rather it was there but the options the book instructed me to select were not. The majority of 4.3 was doable until it asked to me to find a ‘change style’ button which could not be found. With 4.4 being a follow up to 4.3, this made it impossible to proceed with that as well. I was apprehensive with 4.5 as I’ve never been a fan of downloading apps onto my phone for academic reasons as it always signs me up to some email newsletter. In addition my app store account is linked to my fathers email which I don’t have the password for so I was unable to download the app to begin with. I had the same problem with 4.7 and 4.9 being unable to access the app store and with it being late in the evening I was unable to contact my father. 4.6 was also broken as I was unable to uncheck a ‘only search in your organization’ button and this part of the tutorial relied on data that would’ve been created with 4.3 and 4.4 but because those could not be completed, I was also stuck here. 4.8 had the same issue and 4.6 with no option to uncheck the ability to only search within the organization and multiple results turning up when I input what the book asks me to search. In short, while the reading portion of Chapter 4 was interesting, the tutorial was a nightmare to sit through and try to go back through things to see what I missed. Dr Krygier if you see this, I don’t know what you can do about this, but these books are somehow severely out of date already. At the very least parts of it were doable compared to tutorials 1 and 2 which effectively blocked me from the start.

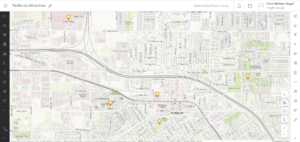
Application Idea: Attempting to go off something I enjoy and using what information I was able to learn in Chapters 3 and 4, as an avid angler, it might be an interesting idea to create a 2D/3D map using a hydrology dataset which shows various fishing locations on bodies of water in a given location, such as within Delaware County. This application could not only give a better view of the area from both a 2D and 3D perspective, and then customized to show what species can be caught in x location and if said location has a history behind it. For example, a 2D/3D view of a spillway beneath a major dam, what species can be caught in the spillway, and the history of the dam itself.

Data Inventory: The instructions say to include it in the posting so not sure if this will transfer over correctly. If it does, fellow students, I apologize for the wall of text. Not sure how else I’m supposed to turn this in.

  • Delaware County E911 Data: Contains all certified addresses within the county. Supports emergency services and geocoding. Updated daily and published monthly.
  • Township: Shows different townships in Delaware county. Updated on a need-as basis and published monthly.
  • PLSS: Shows all Public Land Survey System polygons in military districts. Shows boundaries between PLSS systems. Updated on a need-as basis and published monthly.
  • Dedicated ROW: Consists of a map of roadways designated ‘right of way’ within Delaware County. Updated on an as needed basis and published monthly
  • Zip Code: Shows all ZIP codes in Delaware county based on a 2003 census. Updated on an as needed basis and published monthly
  • School District: Shows all school districts in Delaware county based on parcel records. Updated on an as needed basis and published monthly.
  • Street Centerline: Depicts the center of the pavement of public and private roads within Delaware County. The data is intended to support appraisal mapping, 911 emergency response, accident reporting, geocoding, disaster management, and roadway inventory. Layers are updated daily but 3D fields are updated annually
  • Recorded Document: Dataset consists of points that represent recorded documents in the Delaware County Records. Documents include vacations, subdivisions, centerline surveys, surveys, annexations, and other miscellaneous items. The dataset was created to facilitate the process of locating miscellaneous documents within Delaware County. The dataset is updated on a weekly basis and is published monthly.
  • MSAG: MSAG (Master Street Address Guide) is a featureset of the 28 different political jurisdictions that make up Delaware County. created to ease the process of locating the boundaries between cities and towns. The data is updated on an as-needed basis and is published monthly.
  • Survey: Shows points of land surveys with Delaware County. Most of the data was recorded before 2004 but is still being updated on a daily basis and is published monthly.
  • GPS: Identifies GPS points as established in 1991 and 1997. Published monthly and updated on an as needed basis.
  • Parcel: Shows all polygons that represent cadastral parcel lines within Delaware County. This data is maintained by the Delaware County Auditor’s Office. The data is maintained on a daily basis and is published monthly.
  • Tax District: This set of data consists of all tax districts within Delaware County. The data is defined by the Delaware County Auditor’s Office. The data is updated on an as needed basis and is published monthly.
  • Subdivision: Shows all subdivisions in Delaware County. The data is updated daily and published monthly.
  • Precinct: Shows all of the Voting Precincts within Delaware County. The data is maintained by the Delaware County Auditor’s Office. The data is updated on an as needed basis and is published as needed by the Delaware County Board of Elections.
  • Annexation: Data contains Delaware County’s annexations and conforming boundaries from 1853 to present year. The data is updated on an as-needed basis and is published monthly. 
  • Municipality: Shows all municipalities within Delaware County.
  • Building Outline 2021: The data here consists of building outlines for all structures in Delaware County, Ohio as of 2021. Updated on an as needed basis.
  • Address Point: Shows the data from the Location Based Response System (LBRS) and shows all addresses in Delaware County. The data is intended to support appraisal mapping, 911 Emergency Response, accident reporting, geocoding, and disaster management. The data is updated on a daily basis, and is published monthly.
  • Condo: Dataset consists of polygons representing condominiums in Delaware County that have been recorded by the Delaware County’s Recorder’s Office.
  • Farm Lot: The data here consists of all the farm lots in both the US Military and the Virginia Military Survey Districts of Delaware County. created to facilitate in identifying all of the farm lots and their boundaries in Delaware County. The data is maintained on an as needed basis.
  • Original Township: This data consists of the original boundaries of the townships in Delaware County, Ohio before tax district changes affected their shapes.
  • Hydrology: Shows all major waterways in Delaware County.
  • ROW: Consists of all lines designated as right of way.
  • Delaware County Contours: Shows the contours of the terrain in Delaware County.

Nagel Week 3

Or is it technically week 2? I don’t know but I’m gonna call it week 3 for simplicity. Chapters one and two are fairly interesting but also very confusing. Chapter 1 introduces the basic aspects of Web GIS, such as the ‘cloud’ for data sharing and storage, the evolution of the software (can I even call it software if its all online?), types of users, content, and apps. Now I thought 291 was painfully technical in its explanation of things but I’ll say this for the record; 292 and Web GIS takes the technical aspects of 291 and cranks it up to 100. Half the things the chapter tries to explain go directly over my head and therefore my feeble little brain fails to comprehend any of what is said. The book content tutorials are similar to the ArcGIS program at least. For the 1.3 tutorial there was no ‘community map’ as asked by the steps in the tutorial. Everything else went smoothly until attempting to create the app with which I was met with a blank screen that didn’t load a preview even after 10 minutes so not sure what’s going on there.

Chapter 2 discusses web apps further and going more into different features such as ‘feature layers’ which allow you to style and customize them in a way that fits your needs and can be used to create a ‘story’. For example, different types of ‘smart mapping’ are shown which can be utilized. The chapter also discusses the ArcGIS Atlas which if I recall correctly was used briefly in 291 but I may be mistaken. Overall the chapter discusses ‘storytelling’ which now that I think about it seems odd to discuss in this setting but I digress. In tutorial 2.3, working the attribute expressions didn’t work either as the book asked me to input a code yet there were no options to do what it was asking me to do. I have the 5th edition book so I don’t know why things aren’t working… I’ll need to sort that out next week as I can’t complete the work like this if I just keep hitting dead ends halfway through the tutorials.

An idea for a map utilizing information from chapters 1 and 2 and also using data from 291, an interactive app could be developed towards those engaging in recreational activities involving water (boating, fishing, swimming, etc) that displays the sources and spread of things such as pollution and algal or bacterial blooms using data published by whatever local government organization publishes data on said factors. This could warn water-goers of these areas and focus cleanup efforts on said areas.

Nagel Week 1

Introduction:

I imagine that since this is the follow up to 291 that most of us are already acquainted but just to recap my name is Chris. I’m a senior and a ENVS major/Zoo minor. While 291 wasn’t my favorite class, I still found parts of it interesting. Also just as in 291, I completely missed the email which would give me access to post on the site at first and spent around 30 minutes trying to figure out what I did wrong until I found the email with the invite link…

Poking Around:

I had already poked around a bit previously in 291 so I’m slightly familiar.

  • Not sure what counted as ‘basic info’ so I just reiterated what I said in the introduction in the bio
  • Going to ‘My Esri’ it seems that I need to obtain permission from an ‘administrator’, that I imagine being Dr. Krygier. Not sure if that’ll pose an issue down the line but I don’t think so as it seems to only be connected to viewing information regarding the ‘organization’.
  • It is interesting to see how there is an entire dedicated forum and community revolving around the software. I shouldn’t be surprised that there is but still.

Reading:

  • It seems as if the website has a lot in common with the ArcGIS software in regards to functionality and features
  • Much of the website seems to be dedicated to the sharing of information with others, both inside and outside the ‘organization’.

Online Training

  • Training is helpful and provides more context on new info
  • Did not feel like it took two hours to complete despite what the average time said
  • Quizzes were not terribly difficult

Applications:

One application I found for the use of the ArcOnline software was that being utilized by the US Department of Transportation for the analysis and mapping of vehicle noise emissions, such as those created by commercial aircraft.

https://hub.arcgis.com/documents/usdot::2018-noise-data/about

Another application I found was the mapping of protected marine zones for use by anglers in California

https://cdfw.maps.arcgis.com/apps/webappviewer/index.html?id=c00c82e1f32a49e99c747e2411e3439e