Luna – Week 9 (Final Apps)

App 1: https://owugis.maps.arcgis.com/apps/instant/interactivelegend/index.html?appid=90dab0ef6a2746b295872c46d09f7f01&locale=en-US

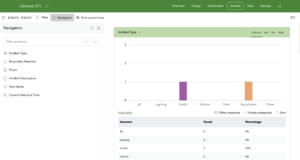
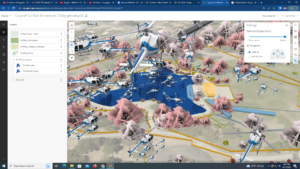
For my first application, I chose to make an interactive experience with Instant App. In this application, users can do one of two things: click on a point or click on the legend. When the user clicks on a point, it reveals the address and land use type. When they click on a land use type in the legend, however, the map will highlight any properties that are for that specific land use. This application is very simple, but could be used to help in city planning.


App 2: https://experience.arcgis.com/experience/2940cc7c85cb4f338376b2e7c2ffe35c/

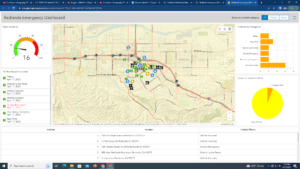
For my second application, I found myself, once again, gravitating towards the address data from the Delaware Data. To make it a little different this time, I used Experience Builder to add a few widgets to the map. In this app, users can still click on a point to see the address and land use, but they can do a few more things. To begin with, they can search for an address and get information that way. They can also see the pie chart widget that I added to see the different proportions of zip codes, which is something that was not really included in my first app.

Luna – Week 6

Chapter 7

Application: This could be used to visualize the different natural elements that can be seen around Delaware. While it is not as effective with how many buildings there are in Delaware County, but with parks or other places like that, this could be really useful.

Luna – Week 5

Chapter 6

Application: This could be used in many ways with Delaware Data. My first thought would be to use it in the same general way using crime data. This could also be used with any other activity or information because it can show all different aspects of a data table.

Luna – Week 4

Chapter 3

Chapter 4

Application: I think that both of these chapters can be used in different ways. I think that the widgets could be used to create a more interactive map of Delaware. The surveys, on the other hand, could be used to collect information and possible direct people that are newer to Delaware.

Week 6 – VanderVelde

Chapter 7:

  • Understand the basic terminology of web scenes
  • know the types of scene layers and technologies to create them
  • create web scenes using scene viewer
  • Understand the value of 3D in XR, meta verse, indoor GIS and AEC
  • Configure 3D symbols in scene viewer
  • Create and use feature layers with z-values enabled

7.2

7.3

Week 5 – VanderVelde

We skip chapter 5!! im so happy!

Chapter 6:

  • understand spatio-temporal data terminology
  • Learn the concepts of IoT, Sensor networks, smart cities and other related frontiers
  • Understand the advantages of stream layers
  • learn about ArcGIS Velocity capabilities
  • Use ArcGIS dashboards to monitor real time data
  • Configure actions and Arcade-based formatiign
  • Create Time-enables web layers and apps to animate time series data

Skidmore Week 5

Chapter 6:

I personally really enjoyed this chapter and how everything was put together. I found everything done had a purpose and could be used in other scenarios, which I found really helpful. Also, the last example seemed a little out of place within the chapter compared to the instance with the dashboard. This was one of the easier chapters as a whole though

.

Munroe Week 6

Chapter 7: 3D Web Scenes

Main elements in 3D scenes

  • Surfaces: Continuous measurements, typically elevation, with one value for a given x,y location
  • Features: On, above or below surfaces. Operational layers
  • Textures: Exterior or interior covers of 3D features
  • Atmospheric effects: Ex. lighting and fog

Web scene layers

  • 3D object scene layers
  • Building scene layers
  • Category layers
  • Filter
  • Integrated mesh scene layers
  • Point cloud scene layers
  • Point scene layers
  • Voxel scene layers

Munroe Week 5

Chapter 6: Spatiotemporal data and real-time GIS

ArcGIS Velocity and GeoEvent Server

  • Ingest: Provides ways to communicate with IoT platforms, sensor networks, social network feeds and other real-time data streams
  • Process: Processes the real-time data received and translated by the ingestion component
  • Output: Sends processed data to a variety of destinations, including writing to a data store, sending data to web clients, alerts through SMS/email

New ArcGIS Velocity Items

  • Feed items
  • Real-time analytic items
  • Big data analytic items

Munroe Week 4

Chapter 3: ArcGIS Experience Builder

Editions of Experience Builder

  • Embedded in ArcGIS Online
  • Embedded in Portal for ArcGIS
  • Developer edition

Widgets

  • Basic Widgets: Functional and can perform as app tools
  • Layout Widgets: Help organize widgets on pages or windows
  • Message Actions: Listen to triggers and perform actions automatically
  • Data Actions: Provide an actions button that users can click in widgets at runtime and select from a list of actions to perform
  • Triggers: Events generated by the source widget
  • Targets: Perform actions responding to the trigger
  • Actions: Specific business logic that the targets perform

https://experience.arcgis.com/experience/8291f9325ace4e2e8652b02dec691471/

Chapter 4: Mobile GIS

Mobile GIS Concepts and Advantages:

  • Mobility
  • Location Awareness
  • Ease of data collection
  • Near-real-time information
  • Large volume of users
  • Versatile means of communication
  • Built on mobile devices, mobile operating systems, wireless communication technologies, and positioning technologies