Month: March 2023
Luna – Week 1
Hi! My name is Lydia and I am an Environmental Science major!
Account Comments
- I did not have a bio so I added where I go to school and what my major is.
- I did not know about the trainings that were offered and I think that it’s interesting that they seem to know that their program can be complicated but are willing to offer programs to help with the confusion.
Get Started Guide Comments
- After doing Desktop GIS at the beginning of the semester, I think it’s very helpful that Web GIS allows for some more collaborative work because while I appreciate the way that I need to individually learn the skills for assignments, the work can sometimes be tedious, so collaboration could be very beneficial in the future.
- I also think that it’s constructive that ArcGIS has many platforms that can all be used for one project.
Training Comments and Screenshots
- This training really made me look at the ways that GIS can be used and the reasons why different levels of privacy are useful in different situations.
- I also found this training useful because it pointed out the locations of the basic functions that were different from ArcGIS Pro.


Articles
- A Web-Based GIS Waste Data Management System (Claudia Attard and Sergio Tartaglia): using Web GIS to track waste management and the systems regarding it
- Web-mapping of environmental pollution of the surface waters of the Lviv region (Sohor A.R., Fys M.M., Brydun A.M., Sohor M.A.): using Web GIS to observe surface water pollution
Data Inventory
- I already completed this during GEOG 191 🙂
Week 2 – VanderVelde

HWA on a Hemlock tree 🙁
Week 1 – VanderVelde
Hello, my name is Evelyn VanderVelde. I am a senior from Holland, Michigan majoring in environmental science and minoring in botany.
 Two articles:
 Delaware data Inventory is already completed.
- for my assignment this week, I already have a account made from the 191 class with Krygier and my Intro is above. I updated my Bio so now y’all can know some basic things about me.
- In my blog I found all of my assignments from 191 as well as that the website format has updated and these knew posts are bugging me. I liked the last formatting of the posts to be much easier because they were more simple.
- Share and Collaborate – I learned that sharing your maps on ArcGIS online is easier with the groups that are private. I have some experience with groups with my job with the Michigan DNR this past summer. As well as making collaborations with other groups to share each others maps and work on each others content. Other ways to share maps and other content include embedding them in web pages, on blogs, in web apps, and through social media. Use focused apps to collaborate with colleagues in the field, office, or community.
- Be mobile in the field- On arcGIS online you can also access your maps in your mobile device whether this be a tablet or smart phone. Meaning that data can be collected directly from the field onto the map itself and updated to the entire crew in real time.
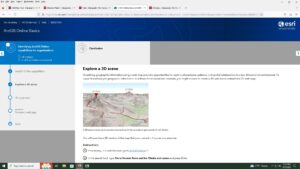
- I found that I learned about exploring a 3D scene
- I also learned that when you move to a different bookmark in one of the tutorials that the base-map changes from Topographic to Imagery
Two articles:
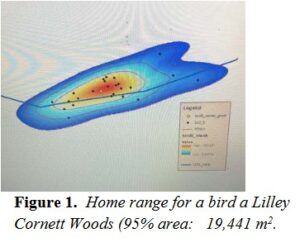
- for the first article i looked up arcOnline hemlock because that is one of my favorite trees. In THIS article they used arcOnline to create a spot map of the home range for a species of bird that nests in Eastern hemlock trees.
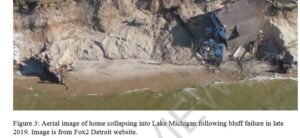
- For my second article I looked up ArcOnline Michigan coast and found THIS link from a Michigan state grad students thesis project. This article did not include any of the maps that they used to collect their data besides an image from one of their Arial images collect by a satellite about the declining coast of lake Michigan in correlation to human infrastructure.
Delaware data Inventory is already completed.
Munroe Week 1
Hi! My name is Jonathan Munroe. I’m a junior from St. Louis, Missouri majoring in geography and minoring in music performance.
I already completed the first few steps in this week’s posting during the last course and have had an Arc account since freshman year. Two things I noticed when looking through my account were:
- I didn’t have a bio. I decided to create a brief bio including my hometown and major/minor.
- I went through all my old projects to review what I’ve completed in the past. I had forgotten how many storymaps I’ve made through the years, creating projects for Urban Geography, Geography of Pop Culture, Science Behind Climate Change, Cultural Geography, and The Power of Maps and GIS.
Two things I learned from Get Started: What is ArcGIS Online
- Slides. I learned that slides let you capture the state of the scene. This is helpful when needing to tell a story through your map, especially when needing to show the difference between factors like camera position, daylight settings, etc. To do this, click slides on the designer toolbar, click capture slide, name it and hit save. This will capture the scene of your map at this moment, and allow you to return to it as it has been successfully saved.
- Floor-aware maps. These maps contain GIS data from inside buildings and organize it into floor-aware layers, good for visualizing indoor spatial data. To do this, click map properties on the contents toolbar and find the indoor layers section. From there, turn on enable floor filtering and select the layers that correspond. You can also specify additional line, point or polygon feature layers. Click save and it will be added to the map.
Training Course
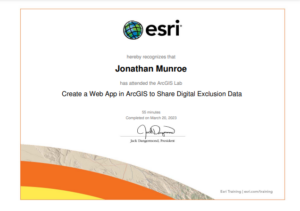
- I already completed the web course for ArcGIS Online Basics so I found a course titled Create a Web App in ArcGIS to Share Digital Exclusion Data. This course utilized ArcPro and ArcOnline to show how the two programs work together. Two things I learned were:
- How to utilize pop-ups with graphs to better display data for specific counties
- How to create and apply web apps onto my online maps.

Two Articles:
- Yolanda F Wiersma and Randolph Skinner: Predictive distribution model for the boreal felt lichen Erioderma pedicellatum in Newfoundland, Canada
- This application took forestry data from Newfoundland and information regarding boreal felt lichen habitat suitability and applied it together to create a map highlighting the expanse of where this species would grow in Newfoundland

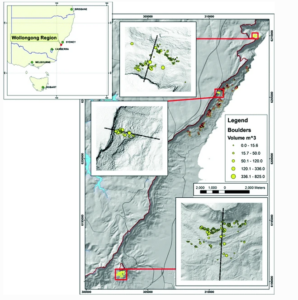
- Phil Flentje, Darshika Palamakumbure, Jack Thompson: Assessing Rockfall Along the Illawarra Escarpment
- This application mapped rockfall data from the Illawarra Escarpment surrounding Wollongong, where I studied abroad in the fall semester, using 2D and 3D modeling.

McConkey – Week 1
My name is Jay McConkey and I am a senior environmental science and geography major.
I have already accessed my ArcGIS account from previous classes, but I updated my bio to include my graduation year and majors. I browsed through My Content and saw the maps I generated from GEOG 191. Next, I clicked Training and viewed the various modules, noting which ones are available for free and which are not.
About ArcGIS Online:
While ArcGIS Pro possesses the tools necessary for more complex analysis and customizability than ArcGIS Online, ArcGIS Online strength’s includes easy access to mapping software along with sharing or collaborating data or maps. ArcGIS is more accessible as you can log in on mobile devices or through web pages rather than being limited to a computer that is able to support ArcGIS Pro software. ArcGIS Online is great for sharing, exploring, and managing data as well as creating maps, scenes, and apps. Python coding can be utilized and be saved in Notebooks while data layers can be saved and published on ArcGIS Online as web layers. ArcGIS Online is a great tool to use when collecting data or mapping data in the field, where it can be further analyzed under ArcGIS Pro at a different time.
ArcGIS Online is a great tool to allow a select group of people or multiple groups of people to access and share relevant maps. It is advantageous for companies and large groups to use ArcGIS Online as it makes maps more accessible for other collaborators to join in. Scenes, which can be used in ArcGIS Online, allow you to visualize and analyze geographic information in interactive ways.
![]()
Two courses that interest me are Working with Raster Data Using Python (free) and ArcGIS Notebook Basics (requires maintenance).
I have already completed the Delaware Data entry.
Potential Applications:
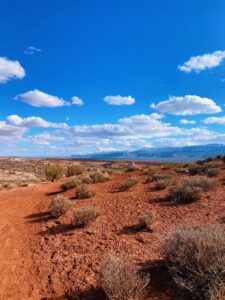
Mubako, Stanley, et al. “Monitoring of Land Use/Land-Cover Changes in the Arid Transboundary Middle Rio Grande Basin Using Remote Sensing.” Remote Sensing, vol. 10, no. 12, Dec. 2018, p. 2005. Crossref, https://doi.org/10.3390/rs10122005.
Using Landsat imagery from multiple years, these scientists were able to analyze and map land use/land cover changes in the Rio Grande Basin. Studies like these are important because they show patterns in development as well nature ecosystems and topography.

Antoniou, Varvara, et al. “An Interactive Story Map for the Methana Volcanic Peninsula.” Proceedings of the 4th International Conference on Geographical Information Systems Theory, Applications and Management, 2018, https://doi.org/10.5220/0006702300680078.
These scientists were able to make an interactive Story Map of the Methana Volcanic Peninsula and its special volcanic geoforms and cultural monuments. This information can be useful for geographers, volcanologists, students, tourists, or the general public.

Krygier Week 3
 We had an unfortunate incident with a house guest this weekend. A memeaplogy.
Preface: I didn’t assign this but it’s always good to glance at it.
• stuff about updates to this new edition
• lots of jargon. yeesh.
• the tutorial stuff: go.esri.com/gtkwebgis5
How to Use This Book
• I have, I hope, set up all of your ArcGIS Online accounts for Publisher-level access. You should be able to see that in the information about your account. Also, make absolutely sure you are using your OWUGIS ArcOnline account and not a free account.
• We have full blown access to ArcGIS Onliine so don’t bother with the evaluation or trial versions.
• Downloading the exercise data: URL above; there is lots of stuff, click on Full Book Exercise Data on the left side of the screen.
• it plopped on my Mac Desktop as GTKWebGIS folder, with chapter folders inside. Yay.
Chapter 1: Get started with Web GIS
- workflows: ESRI uses this term ALOT
- I’ll just let you know that I created a crowdsourcing (the public could add data to an online ESRI map) back in 1998 and is summarized (with missing links – it’s so old) as Public Participation Visualization: Conceptual and Applied Research Issues. You all were probably not even born then,
- “Science of Where” – corporate jargon – but lots of interesting applications for sure
- ArcGIS Online (SaaS) vs. ArcGIS Enterprise (I don’t think we have access to the latter, or at least we are not running it)
- emergence of GIS web servers (that’s the research I did in the late 1990s!) I’m old!
- one to two way information flow: that’s me too, back in the olden days
- portal technology: fancy way of getting access to tons of data
- cloud GIS: like custom built mini-GIS software that runs on a broswer (rather than using all of ArcGIS Pro)
- mobile: field work, in vehicles, etc.
- visualization (more of my background; shifting from just viewing data to the idea that you can interact with and think and understand and learn new stuff; tools to do this; 3D, virtual reality, modeling)
- static vs. real time data
- AI and web GIS: scary
Web GIS Information Model: this is worth looking at a bit more carefully for background
- user privileges: I’m the master of the OWU ArcOnline site and can adjust these privileges for you
- metadata
- sharing
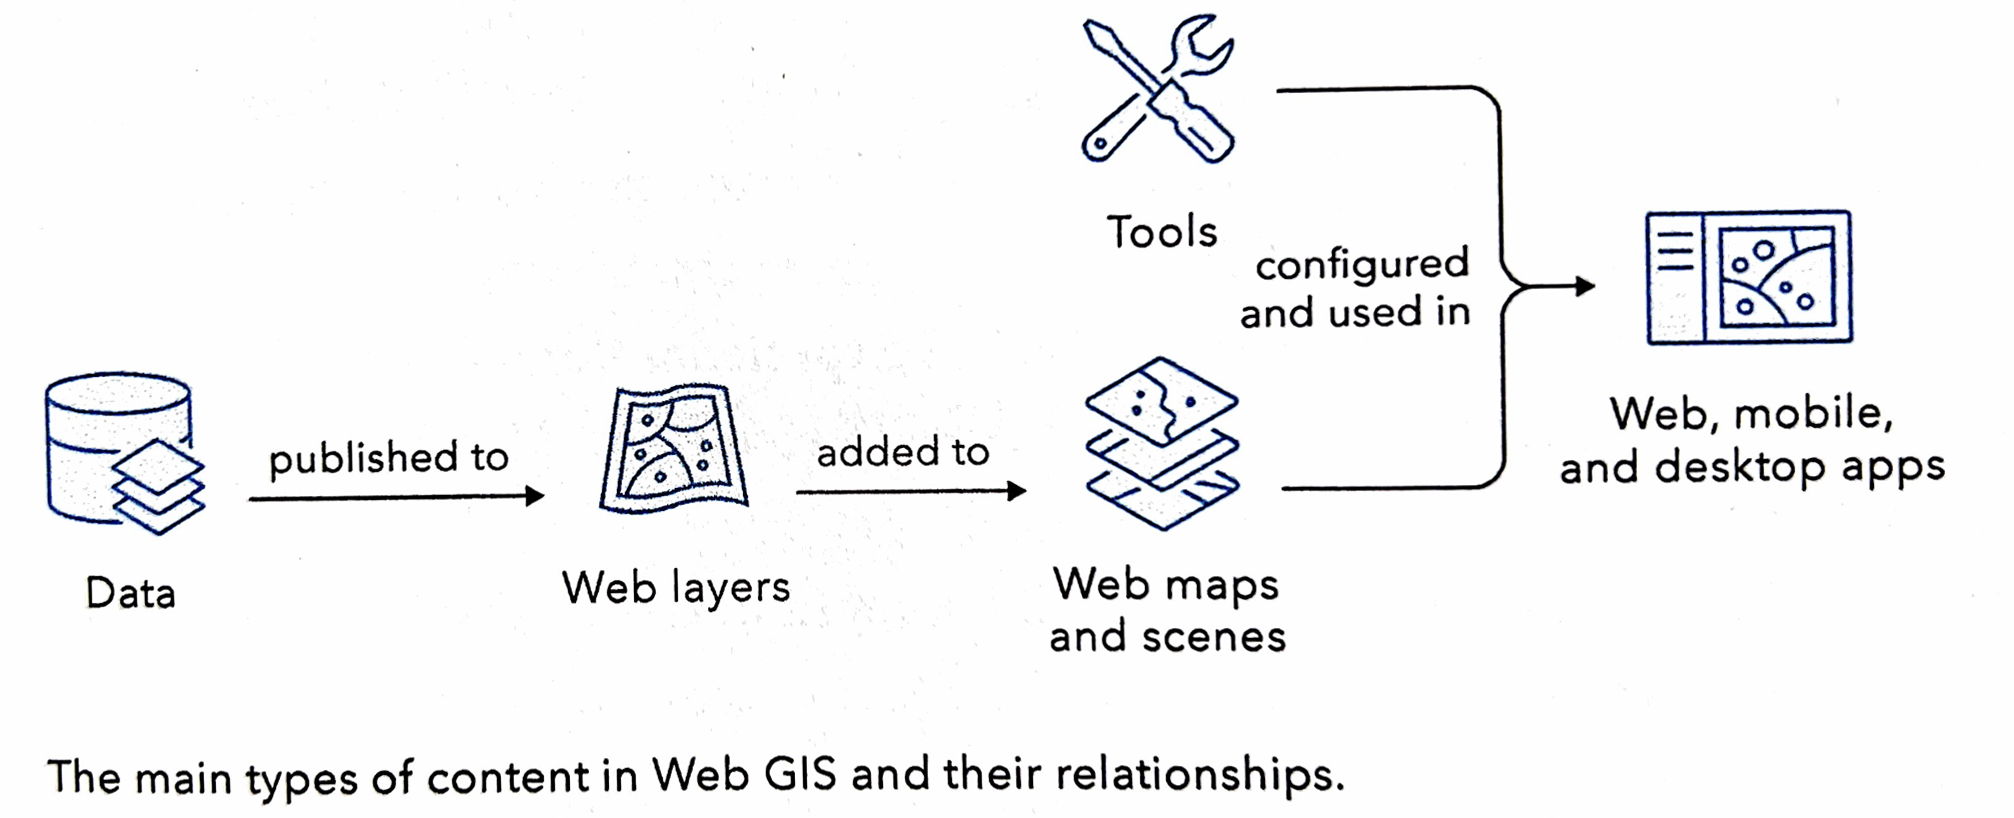
- content: data, layers, tools, webmaps, scenes, apps
- Apps: you can creat these but there are also specialized Apps that ESRI proides. We have some of these, like Drone-to-Map
- ArcGIS User Types
- Basic compenents of a Web GIS app: basemaps (background map stuff), operational layers (data of interest – say mapped out sites of invasive species), tools (function on the operational layers, also sometimes the basemaps)
- Web Services = web layers & web tools (in essence provide users with functionality via the web)
- Feature layers: this is vector data (point, line, area)
- hosted feature layer: hosted by ESRI
- non-hosted feature layer: hosted by user (like you, using OWU site)
- Web maps vs web scenes
- Paths to building Web GIS applications: “workflow” – how you put together applications that users can access via the web using the data and layers and tools and functionality of ArcGIS Online.
- Attachments: for example, we could make a web map application for OWU and Delaware that locates PDFs of projects that focused on those areas, say a PDF about restoring the Delaware Run along the old part of campus, linked to a polygon of that area. Also, images, sounds, etc.
Tutorial 1: Simple map application with attachments.
- some minor glitches but all were easy to figure out

Application: I changed the text on the course schedule:
- Include a few-sentence description of an application based on ideas from chapters 1 & 2, using your own data or the Delaware Data (from Geog 191). This edition of the tutorial includes ideas under “Assignment” (p. 35 in the 5th edition of the tutorial).
- My example application: A map, similar to the one from the tutorial, showing the locations of the ENVS 399 Sustainability Practicum projects for Spring ’23. Proposals (PDF), images (PNG), etc. for each location.
Chapter 2: Smart Mapping and Storytelling with GIS
- web layers, web apps, StoryMaps
- web app workflows for StoryMaps (below)

- feature layers: focus of Ch. 2 is hosted feature layers
- smart mapping: syles illustrated p. 41
- pop-ups
- ArcGIS Arcade: expression languages for adding your own info to data hosted by someone else
- ArcGIS Living Atlas of the World: updated in minutes/hours
- ready to use data created by ESRI and other folks
- incoporate in your own map apps.
- basemaps, imagery, boundaries, human data, infrastructure, environment
- StoryMaps
- uses block formatting (annoying but common for web design)
Tutorial Ch. 2: Web GIS app of population change using ArcGIS Story Maps
- geocoding: address matching (link address or geolocation data – street address, zip code, etc.) to location
- notice (p. 51) that you are using credits! You each have 1000 credits (which cost money – but we get them free as part of our educational deal. If you work for an organization, this is where you spend money doing stuff with ArcGIS Online)

The finished StoryMap: https://arcg.is/fa5Wb1
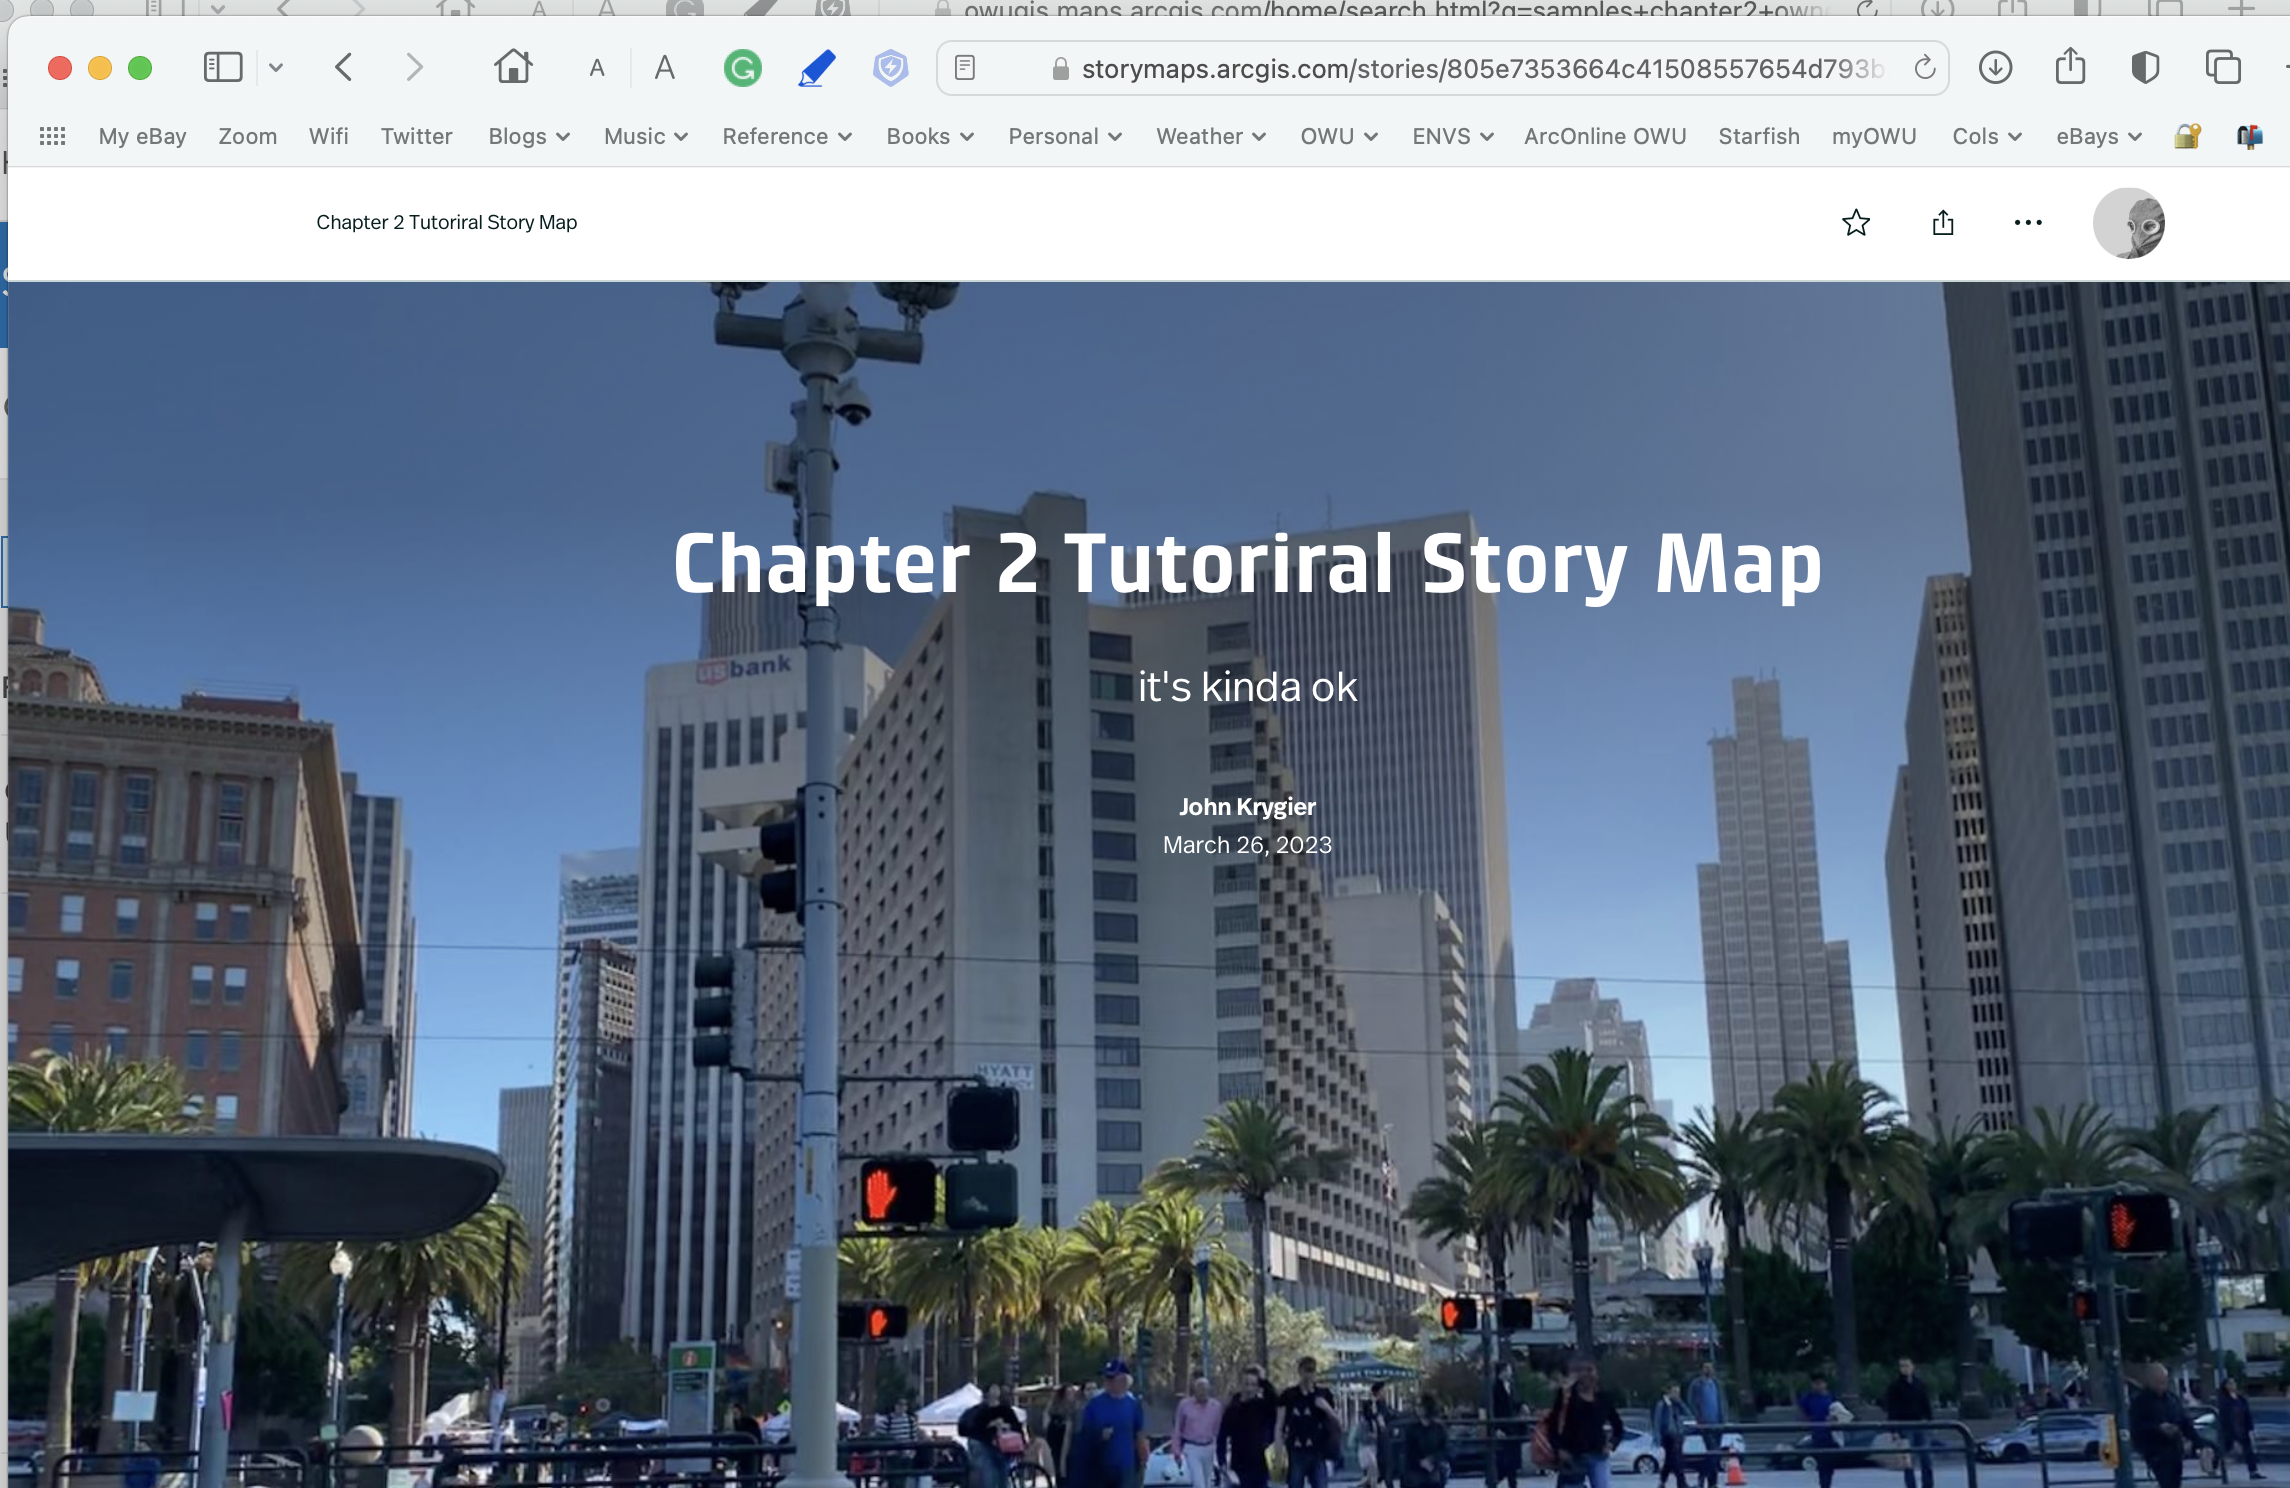
and so on…

Application: I changed the text on the course schedule:
- Include a few-sentence description of an application based on ideas from chapters 1 & 2, using your own data or the Delaware Data (from Geog 191). This edition of the tutorial includes ideas under “Assignment” (p. 35 in the 5th edition of the tutorial).
- My example application: A Story Map, similar to the one from the tutorial, telling the story of the Chimney Swift Tower project since the idea was first proposed a decade ago with proposals (PDF), images (PNG), information on chimney swift migration (from central America) etc.