Dahlstrom Week 5

Chapter 7

In this chapter, I learned about creating and using web scenes, or 3D maps. Web scenes are becoming increasingly important because they have advantages over 2D maps in visualization, analysis, and communication. The visualization aspect of web scenes can be categorized into two groups: photorealistic and cartographic. A photorealistic map aims to create a version of reality, while a cartographic map uses 3D representations to highlight features or symbols. The elements that make up the analysis portion of web scenes include surfaces, features, textures, and atmospheric effects. In particular, the building scene feature layers stood out to me as extremely useful because they allow you to visualize complex models of potential buildings and their components. Finally, the chapter details how we communicate information in these web scenes through VR, XR, and Metaverse. While the concept of Metaverse seems a bit disturbing to me, I appreciate how these technologies create immersive experiences in the maps. Additionally, something cool I learned in this chapter was that ArcGIS CityEngine was used to create massive urban environments in many Disney and Pixar movies. In the tutorials for this chapter, I learned how to create a web scene from a 2D map, symbolize 3D objects, perform a basic 3D analysis in Scene Viewer, and a variety of other techniques in web scenes. These tutorials have probably been my favorite so far because they were relatively easy for me to navigate and I enjoyed working with 3D maps more than 2D.

Application Idea: I would create a web scene of Margaret Sagan Softball Field here on campus. The layers I would add include the field and the surrounding scenery (point layer), the sprinkler system (underground layer), and the dugouts (extruded polygon layers). I would also include fences, the press box, bleachers, trees, pathways, and objects that provide context to the surrounding area.
Dahlstrom Week 4

Chapter 5

In this chapter, I learned about the components and techniques used in ArcGIS Enterprise. ArcGIS Enterprise is similar to ArcGIS Online, but Enterprise allows you to work on a private server while Online does not. Notable software components of ArcGIS Enterprise include portal, server, adaptor, and data source. These components perform functions together to run Enterprise such as managing content, creating accessible geographic information, providing security, and storing configured data. The chapter then shifted to giving an overview of the different map layers such as raster tiles, vector tiles, map image layers, and feature tiles. While I remembered the function of these layers from GEOG 291, it served as a useful refresher. Additionally, I appreciated the inclusion of the table recommending which layer to use when you have certain types of data. The tutorial of this chapter involved working with both ArcGIS Online and ArcGIS Pro. I learned how to add a portal connection, publish a vector and raster layer from ArcGIS Pro to ArcGIS Online, and got further acquainted with StoryMaps. I thought this tutorial was useful because it connected web GIS to desktop, which some people don’t have access to.

Application Idea: The assignment for this chapter just requires us to publish a raster layer and vector layer and compare the layers side by side. I would choose to make the layers with data from the previous tornado pathways in Kentucky. It also tells us to have a brief description of the differences between raster and vector tile layers. Raster tile layers are most appropriate for basemaps or maps with data that do not change a lot over time. They can provide advanced placement, symbology, imagery, and elevation data. Vector tile layers contain the geometries. The size of a vector tile is usually smaller than that of a raster tile because they are generated based on data density and resolution preference. The map style of a vector tile layer can be customized without having to regenerate tiles.

Chapter 6

This chapter introduces the concept of spatiotemporal data. Spatiotemporal data examines the where and when events occur and includes observations of objects and events that move or change through time. This type of data can be categorized into four groups: moving, discrete, stationary, and change. Seeing that all spatiotemporal data happens through time, the value of time is very important. Depending on the data at hand, time can be either measured at a point or a duration. The other part of spatiotemporal data is the physical objects themselves you are measuring. The internet of things (IoT) is the network of physical objects embedded with sensors and network connectivity that enable objects to collect and exchange data. The chapter also included a variety of graphs and charts in this section, which were very helpful in explaining the concepts. Lastly, I was introduced to a variety of apps associated with spatiotemporal data such as ArcGIS Velocity, ArcGIS Dashboards, and ArcGIS Mission. For the tutorial, the first exercise had me work with various features of Dashboards. While I didn’t run into any problems since I was already familiar with the app, I did find the script section a bit challenging. The second exercise allowed me to create a time-enabled feature layer, which I really enjoyed the presentation of.

Application Idea: For this chapter, I would create a map showing how the percentage of land used in the United States has changed over time. To do this, I would symbolize the land used for agriculture with a unique color and create a time-enabled feature layer to show the change over decades. I could also create a dashboard from this data with the time scale map as the central focus, a chart displaying the percent change in land used for agriculture, and a list showing the states with the greatest percent change.

Dahlstrom Week 3

Chapter 3

In this chapter, I learned about the different aspects of ArcGIS Experience Builder. Experience Builder is an app that uses widgets to combine different apps such as mapping, table views, querying, charting, and reporting. The app layout is based on the components pages and windows. Pages provide the different sections of Experience Builder, while windows provide the content in those sections. Within the pages and windows, there are widgets. The two types of widgets include basic and layout. Basic widgets perform foundational aspects of the app such as maps, legends, layers, filters, and charts, while layout widgets help organize these basic widgets. In this chapter’s tutorial, I created a web experience using Experience Builder. I learned skills such as how to integrate 2D and 3D maps into the app, organize and animate widgets, configure map actions, configure dynamic content, and many other basic functions of the app. While I was able to complete the tutorial successfully, I did run into a few minor issues. For example, some of the book steps did not exactly line up with the app, leaving me to explore the app to find the point of reference. I also could not add the link to the “Alerts” page. To fix this, I went to the site and copied the new URL that was compatible with the app.

Application Idea: I would create a web experience based on my application idea from chapter 2 (percent change in annual rainfall throughout the United States). One half of the experience would be a 2D map displaying the percent annual change in rainfall throughout the United States in the form of graduated colors. The other would be a 3D map with height representing the quantity of change and color representing a positive or negative change. I would add map actions to mirror the location of selection on both maps. Other pages would include one detailing a variety of statistical analyses and one linked to a flood relief website.

Chapter 4

This chapter explored all there is to know about Mobile GIS. This chapter was particularly interesting to me because although I knew that GIS was involved in many things, it really put into perspective just how widely it is used. While the chapter initially detailed some navigational information, it mainly focused on the different apps of Mobile GIS. By explaining what the apps were for and how they are directly applied into society, I was able to identify the apps that were and will be the most useful to me. Something that I appreciated in the tutorials of this chapter was that it was split into four different exercises. By doing this, I was able to more thoroughly understand the apps better since I was able to individually work with each one. The first exercise was focused on ArcGIS Survey123. This app reminded me of Google Forms and was easy to navigate and use. During the second exercise, I had some trouble completing the final part because I could not find the steps the chapter was referring to in the app. Exercise three was simple and worked with the QuickCapture app. I enjoyed the premise behind the app because the project that we made in the tutorial seemed like it could be extremely useful. Lastly, the fourth exercise taught me how to prepare data with AuGeo.

Application Idea: The application that I would create would be based on one of the projects that I learned about in one of my classes. I would choose to have people from Delaware County report populations of flowering and native plants they have present on their properties. The survey would consist of them specifying their location, submitting a photo, and describing what the plant looks like and what time it blooms. From this, I would create a map of the possible places for pollinators in Delaware County. The data would represent the pollinator habitats and areas of possible habitat growth.

Dahlstrom Week 2

Chapter 1

This chapter first introduces a variety of background information on ArcGIS Online. ArcGIS Online is accessible to anyone on the web and is prominent in government, business, and daily life. The five main types of content in Web GIS include data, layers, tools, web maps and scenes, and apps. This was an interesting difference from ArcGIS Pro, because while the mapping features are similar on both softwares, Web GIS has the addition of web maps, web scenes, and apps. The tutorial of this chapter introduces me to feature layers and services. Feature layers can be hosted or nonhosted. Hosted features are when you create a web service based on ArcGIS managed data while nonhosted features are for situations when a web service connects directly to user managed data. In this chapter tutorial, I used hosted features. I was introduced to a variety of elements in ArcGIS online that included adding attachments to layers, how to add and edit fields, symbology, how to create an instant app, and a variety of back navigation tools. The chapter finished by offering answers to a variety of commonly asked questions. I found this section to be extremely helpful because if I were to ever have problems with a concept from this chapter, the information is all in one place.

Application Idea: I would create a map of my school’s campus from back home. There are a variety of buildings located in close proximity to each other that include the high school, middle school, agricultural building, technology building, central office, and a variety of sport complexes. These buildings would serve as my points. I would include attributes such as name, longitude, latitude, address, and year built. 

Chapter 2

This chapter continues to focus on feature layers and web apps. The chapter first introduces the idea of smart mapping. Smart mapping includes maps such as color and size, dot density, compare A to B, predominance, and several others. I was then introduced to ArcGIS Arcade. Arcade is an expression language used to style, label, and add values to pop-up menus. Finally, the chapter provides context for Story Maps. Through receiving advice on functionality and what should be included, I was informed on how to make a professional, yet interesting story. The tutorial in this chapter walked me through the process of configuring layer styles and creating a story through StoryMaps. While configuring layer styles mostly consisted of symbology, I did run into an issue with ArcGIS Arcade. My problem consisted of not being able to add the percent sign in the expression editor. I eventually fixed it by retracing my steps and learning I forgot to put quotations around the percent sign. While I remembered some of the information about Story Maps from GEOG 291, the tutorial served as a useful refresher.

Application Ideas: I would create a map that compares the percent change in annual rainfall throughout the United States from 2000 to 2025. From a personal standpoint, I have learned about the changing weather patterns and feel like the area I live in receives more heavy rainfall events. I would use the above and below theme and a color gradient to represent the percent change. The story would be focused on explaining the changes in precipitation and why they are happening.

Dahlstrom Week 1

*I reviewed the course syllabus and schedule to complete the GEOG 292 Quiz. I also have access to an OWU ArcGIS Online account from GEOG 291.*

Hello! My name is Emma Dahlstrom and I am from Lexington, Kentucky. I am a sophomore this year at Ohio Wesleyan University. Currently, I am a declared Environmental Science Major and intend on eventually double majoring in zoology. Although I do not know exactly what I would like to pursue after school, I have always been interested in working in the field of conservation. I am taking GEOG 292 because I am interested in learning more about GIS after taking GEOG 291. Outside of my classes, I am on the university’s softball team and a member of Women In Stem.

Comments On ArcGIS Online:

  • If I ever get stuck when mapping with ArcGIS Online, the training tab would be a good place for a refresher on the basic map making skills of the program. The training tab includes a variety of web courses and even has an area where you can request to talk with a training expert to answer any questions you might have.
  • The help tab will also be useful for any of my ArcGIS Online needs. It allows you to look up a variety of things dealing with GIS and can filter the results that will be most beneficial to you. I feel like it serves as a search engine that covers all the different tabs available in my account.

Comments on Get Started: What is ArcGIS Online:

  • ArcGIS Online has everything you need to create web maps, 3D web scenes, web apps, and notebooks. 3D web scenes allow you to visualize and analyze scenes that present geographical information in an interactive 3D environment. Web apps help you interact with maps and data in your organization. Web notebooks are the place for data analysis. Through notebooks, you can perform an analysis, automate workflows, and immediately visualize data and analysis results in geographic context.
  • In the working with maps section, the article introduces us to a variety of basic navigation tools and components of the different possible map characteristics. This included the basic tutorial of how to use the map viewer, a legend, pop-ups, time maps, floor-aware maps, directions, measurements, and locations.

Comments Web Course:

  • ArcGIS Online uses the software-as-a-service (SAAS) model. The SAAS model allows users to connect to and use cloud-based apps, like ArcGIS Online, over the internet.
  • I learned a lot about the sharing aspects of ArcGIS Online from this tutorial. The different methods of sharing include private, group, organization, and public. I also learned about which method of sharing is best for different situations.

Interesting Online Trainings: Visualizing Data Using Charts in ArcGIS Pro, Forest-Based Classification and Regression Analysis Using ArcGIS Pro

Application 1

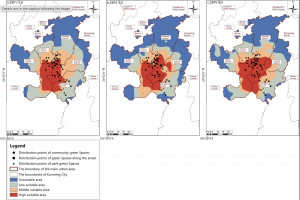
This application identifies areas of habitat stability and priority conservation zones for butterflies. Since the diversity of butterfly communities and their interactions with plants are highly sensitive to environmental change, human activity has caused a drastic decline in many species of butterflies. This is harmful to ecosystem health because without their presence, many plants would not be pollinated. To address this issue, researchers used GIS to map priority zones of habitat conservation for butterflies. This map shows the distribution of suitable habitat areas from 2021 to 2040.

Zhang, Xiaoli, et al. “Spatiotemporal Prediction of Ideal Butterfly Habitats in Kun‐Ming’s Urban Green Areas: Enabled by Maxent and ArcGIS.” Ecology and Evolution [HOBOKEN], vol. 15, no. 10, no. 72300, Oct. 2025, https://doi.org/10.1002/ece3.72300.

Application 2

This application evaluated manatee sightings and mortalities with the intention of changing the Manatee Protection Plan to better suit their movement patterns. In the area of this study, manatee mortality from boating incidents were not declining and the restrictions set to protect them were not being followed. To address this issue, the researchers used GIS to compare manatee trends in relation to vessel traffic. From this map, they concluded that the manatees were being harmed by both non compliant speeding vessels and high traffic. This allowed them to make revisions to the Manatee Protection Plan to better serve the manatees and the people living in the area.

Agosto, Ines. “Using Geographical Information Systems (GIS) to evaluate manatee protection and management in Miami Dade County.” Miami, 1 Apr. 2019, scholarship.miami.edu/esploro/outputs/report/Using-Geographical-Information-Systems-GIS-to/991031447688302976.