Robinson Week 3

Chapter 3:

Chapter 3 provides an overview of ArcGIS Experience Builder. Readers learn the basics of the platform and its features. These include creating HTML and JavaScript apps, 2D and 3D web apps, widgets, flexible layouts, action triggers, and adaptable frameworks. All this is contained within a minimum of 1 page containing one or more windows. These pages can use basic or layout widgets for data or message actions.

This chapter’s tutorial guides the user to create a web experience. It requires the user to create a 2D and 3D web experience. It covers configuring map message actions, dynamic content, and various widgets (table, filter, and chart). Including creating and navigating within multiple pages.

Application: I would create an application to display changes in vegetation and population (with 2 maps). The 2D map would show areas that have significantly lost vegetation using a gradient map. A 3D map would show areas where populations are growing. Map mirroring would be used along with later pages containing specific data of the area chosen.

Chapter 4:

Chapter 4 discusses the use of Mobile GIS, which has been becoming more popular due to the rising use of smartphones. Being utilized for smart devices, mobile operating systems, wireless communication, and positioning technologies. Mobile GIS offers users many benefits, including portability, location awareness, easy data collection, real-time information, large user volume, and versatile communication. This makes it a good choice for indoor and field operations, where ArcGIS offers various applications for these tasks.

In this chapter’s tutorial, readers learn how to use operational applications. Survey123 is one of them, allowing users to design smart surveys, capture field data, store survey results, and collect data. FieldMaps improves data capture, while QuickCapture is designed to capture field observations much faster. The last application in the tutorial is AuGeo, using augmented reality to visualize data.

Application: I would create an application to visualize sightings of the invasive spotted lantern fly. The survey would include the following: date, time, and location. I would add a description box so users can describe what they saw, including adding a photo of the scene. A map would be created from this data to show recent sightings of this specific insect.
Robinson Week 2

Chapter 1:

Chapter 1 provides an overview of the ArcGIS Online platform. Readers learn from behind the scenes what WebGIS (in which ArcGIS falls) offers its users many benefits. These include ease of use and maintenance, cross-platform capabilities, low-cost, scalable cloud technology, and global sharing. These are the reasons why everyday people to government agencies use it. It has evolved from a one-way (information) flow closed website. To the modern age of portal technology, cloud services, 3d/virtual maps, and spatiotemporal data. Connects with newer, two-way open geospatial web services. It contains various content types: data, layers, web maps and scenes/tools, and apps.

The book’s first tutorial guides the user in creating a Web GIS app. Taking the fundamentals and puts them into practice. Requiring them to publish a hosted feature from provided data. Adding and altering layers, as well as attributes. Finally, taking what they entered or created and making an instant or regular web app with it.

Application: Creating a map of Columbus’ Arena District. The map would contain various points of interest like restaurants, hotels, apartments, and arena buildings. Attributes would include the building name, description, service hours (if applicable), address, longitude, and latitude.

Chapter 2:

Chapter 2 discusses smart mapping and storytelling with GIS. It explains why they’re important and how to use them. Readers learn about the various types of feature layers that fall under two main categories: hosted layers and hosted feature layers. These layers in question have to be styled in a way in order to show off the bigger picture (messaging and patterns). Smart mapping plays a role by using data visualization, symbols, and colors to present geospatial patterns. Examples of these styles include heat maps, predominant, continuous timelines, and vector fields. Readers will also learn about the purposes of pop-ups, ArcGIS Arcade Living Atlas, and StoryMaps.

The next tutorial in the book guides users on creating a Web GIS app. Using data to represent spatial patterns. Requiring them to create feature layers using geocoding. Configuring layers with smart mapping styles and layer pop-ups (using ArcGIS Arcade). Using available information to insert charts and images into layer pop-ups. Finally, interacting with swipe blocks and express maps on StoryMaps.

Application: Creating a map that compares vegetation coverage of Delaware County. Using today’s data and contrasting that with data from a century ago. The StoryMap would explain details about the types of vegetation in the area. It would also explain why these changes occur and what actions should be taken.

Robinson Week 1

*Have completed what was required for the week.*

My name is Darren Robinson, a new Ohio Wesleyan University student starting my first semester here. I transferred from Columbus State Community College after completing the Associate of Science Program in May of this year. One of my favorite things to do is to learn. This can take the form of reading books, watching informational YouTube videos, and my all-time favorite: going to museums. More specifically, natural history or historical museums!

In this mid-semester course, users will focus on ArcGIS Online. In which, I have used it before, but not extensively.Looking around, My Profile is your run of the mill profile and account settings. Forums and blogs are a more community centric medium, like Reddit or Twitter. Before really diving in, it’s important to know what you are getting yourself into. ArcGIS Online has a Get Started page that provides an overview of the platform, information on account creation, and how to work within the online application. Most, if not all, of the material when it comes to working with maps or scenes, content, and data has been mentioned previously in GEOG 291. ArcGIS Online offers training courses for a variety of things. This course requires us to take the Basic Online course. Teaching users the fundamental aspects and what those can potentially offer. Overall, this course was very useful and showed us how to navigate the platform.

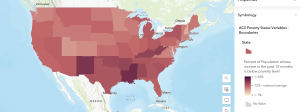
This cloud based software as a service platform can display various things. For example, it could show the percentage of people considered in poverty. Using varying shades of red from dark to light to represent high and low percentages, respectively.

Source: “ACS Poverty Status Variables – Boundaries.” (https://webgis.dor.wa.gov/portal/home/item.html?id=0e468b75bca545ee8dc4b039cbb5aff6&sublayer=0)

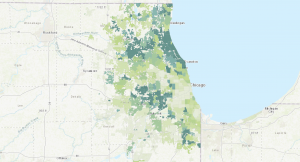
Another use case could be to show the cover of tree canopy in a given area. Using varying shades of green from dark to light to represent high and low coverages, respectively.

Source: “Community Tree Canopy Summaries” , The Morton Arboretum (https://mortonarb.org/plant-and-protect/chicago-region-trees-initiative/community-tree-canopy-summaries/)