Boldman Week 3

Chapter 3

Chapter 3 provided a new way to create interactive web applications using ArcGIS Experience Builder. Experience Builder is an Esri application that allows users to create interactive web applications without any programming skills. It combines maps, data, images, charts, and other tools to create professional web experiences. Users can build applications that provide information from geographic information, locations, view statistics, and interact with maps.

There are different components called widgets to provide specific functions. For example, the Map widget displays geographic information, the Search widget helps users find locations, and the Filter widget allows users to display selected information. There are many different widgets that also assist in organizing data and can present information in special ways. Another important feature of Experience Builder is its ability to combine 2D maps and 3D scenes. A 2D map displays geographic information on a flat surface, while a 3D scene allows users to explore geographic features with height, depth, and perspective.  Using the action function allows widgets to communicate with each other. For example, when a user selects a location from a list, the map can automatically zoom to that location and display related information. Connecting different widgets can make the application more interactive and easier to use. Dynamic content in maps can also be filtered to fit the needs of the user. 

Users can create multiple pages within an Experience Builder application and organize them using layouts, menus, and navigation tools. For example, a tourism application may contain separate pages for tourist attractions, hotels, restaurants, and transportation. Overall, ArcGIS Experience Builder is an application that makes developing web applications functional for all kinds of users by combining geographic data, maps, and visual information.

Chapter 4

Mobile GIS is useful because access to geographic data outside the traditional office environment is flexible for some users. One advantage to Mobile GIS is its ability to collect user time data and it records locations more accurately. Mobile GIS also makes fieldwork easier because information can be collected electronically instead of using paper forms. Some mobile GIS applications support offline data collection, allowing users to work in areas without internet access and synchronize their information when a connection becomes available.

Mobile GIS uses different types of geographic features, including points, lines, and polygons. Points represent locations, lines represent features, while polygons represent areas such as buildings, lakes, and parks. Feature layers store these geographic features together with their attribute information. Users can edit feature layers by adding, updating, or deleting information. Domains can also be used to restrict attribute values to specific choices, maintaining accurate and consistent data.

There are several approaches to developing mobile GIS applications, including browser-based, native, and hybrid applications. Browser-based applications operate through web browsers, native applications are developed for specific operating systems, and hybrid applications combine web technologies with native mobile features. These approaches allow GIS applications to operate on different devices and provide access to features such as GPS, cameras, and location services. 

There are many subsets of applications that ArcGIS provides for mobile GIS. ArcGIS Field Maps allows users to view maps, collect geographic data, and edit geographic features while working in the field. ArcGIS Survey123 is used to create digital surveys and forms for collecting information. ArcGIS QuickCapture allows users to collect information quickly using simple buttons, while ArcGIS Navigator helps fieldworkers find and navigate to assigned locations. These applications improve the efficiency of field data collection and help organizations manage geographic information. Virtual Reality is a growing type of technology that is making it possible for scientists in the field to gather data underground. 

Another important concept in Mobile GIS is Location-Based Services (LBS). These services use the geographic location of a mobile device to provide relevant information or services. Mobile GIS also supports Volunteered Geographic Information (VGI), which refers to geographic information voluntarily contributed by members of the public. People can report traffic accidents, flooding, road damage, and other events, helping organizations gather information from different locations. Mobile GIS is widely used by different companies and agencies. It allows organizations to collect and share geographic information more efficiently, improve field operations, and make better decisions using accurate location-based data.

Application:

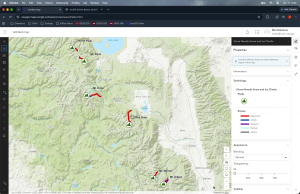
One way that I could apply chapters three and four is tracking different wildlife populations. This would be using multiple approaches such as using Mobile GIS and ArcGIS Experience Builder to create an interactive map showing accurate data. Researchers would use Mobile GIS to collect data and animal sightings and place it directly to coordinates. 
Boldman Week 2

Chapter 1

Introduces the concept of Geographic Information Systems (GIS) and explains how Web GIS is different from desktop GIS. Unlike traditional desktop GIS, Web GIS allows users to access maps and geographic data through web browsers, computers, tablets, and smartphones. GIS is more accessible because users can work with geographic information from different locations without depending entirely on their local computers. Web maps combine different geographic layers to display information in one place, while web applications allow users to interact with maps and geographic data.

Chapter 2

Chapter 2 focuses on how geographic information can be presented through maps, charts, images, and interactive applications. It explains how smart mapping and storytelling help people understand geographic information more easily. One of the important topics in this chapter is feature layers. A feature layer is a collection of geographic features that can be displayed on a map. Geographic features are commonly represented as points, lines, and polygons. Points represent specific locations such as hospitals and schools, lines represent features such as roads and rivers, and polygons represent areas such as counties, states, and land boundaries. Feature layers can also contain attribute information, including names, addresses, population numbers, and other details about geographic features. Smart mapping is the process of using appropriate visual styles to communicate geographic information effectively. Smart mapping allows users to display information using different colors, symbols, and sizes to show patterns and relationships. Smart mapping makes maps easier to understand, helps identify trends, and allows users to compare geographic information. ArcGIS Living Atlas of the World is a collection of geographic information, maps, imagery, and other GIS resources that users can access and use in their projects. It provides information about population, weather, transportation, environmental conditions, satellite imagery, and other geographic topics. Instead of collecting all geographic data independently, users can find existing datasets through Living Atlas and incorporate them into their maps. GIS storytelling involves combining maps, photographs, charts, text, and other media to explain geographic information and communicate important ideas. ArcGIS StoryMaps is a tool that allows users to create interactive stories using geographic information. It helps communicate geographic problems and findings in a way that is easier for people to understand. These principles help users navigate maps and understand the information being presented. Geocoding is the process of converting addresses or place names into geographic coordinates, such as latitude and longitude. This allows addresses to be displayed as points on a map.  A pop-up may show a location’s name, address, photographs, statistics, and other information. Finally, Chapter 2 explains how images and charts can be added to map pop-ups to make geographic information more informative.


Possible Application:

A good GIS application should have a simple layout, clear information, organized content, useful interactive features, and an attractive appearance. Cedar Point is a popular tourist attraction located in Sandusky, Ohio, along the shores of Lake Erie. The purpose of this Web GIS project is to apply basic GIS concepts by creating an interactive map that identifies Cedar Point’s location and highlights important geographic features and nearby points of interest. The project demonstrates how Web GIS technology can be used to visualize geographic information, organize spatial data, and provide useful information to visitors.

Boldman Week 1

My name is Mia Boldman, and I am currently a junior at Ohio Wesleyan University, majoring in Zoology and Environmental Science. I am interested in conservation, particularly within national parks. I believe that GEOG 292 will grow my understanding of ArcGIS Pro and expand my knowledge of GIS. With the skills I learn in this course, I hope to take my knowledge and apply it in my career by using GIS in environmental research and conservation initiatives.

ArcGIS Online is software to analyze data, create maps, and manage information. There is a wide range of map templates, from 2D and 3D maps to creating web apps. The online portal is an easy way to share data and maps whether they are public or private. There are a multitude of tools available to analyze data, recognize patterns and understand geographic information. If I wanted to upload my own data, I can and it can be accessed in the Esri cloud accessible by others. I’ve  ArcGIS Online makes GIS more accessible and allows for collaboration to analyze, create, and manage any kind of geographic data. 

ArcGIS Online has many different resources available in one place. The Training and Help sections can be useful when learning how to use different tools or when I need help completing a task. I found that ArcGIS Online has a Community and Forums section where users can share questions and solutions. This could be helpful when I need help that I can’t figure out on my own.

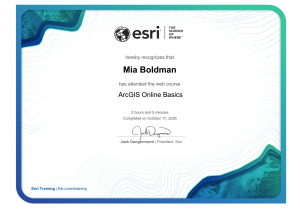
The ArcGIS Online Basics training is helpful because it introduces the main tools and features available in ArcGIS Online. It helped me learn how to create maps, add and manage layers, search for geographic information, and share maps with others. This training is useful because it explains the basic steps in a simple way and provides practice with tools that can be used for future GIS projects and assignments.


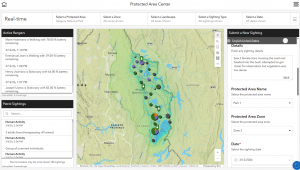
ArcGIS can be used to track and manage protected areas by creating maps that show the locations and boundaries of parks, wildlife areas, forests, and other conservation lands. It allows managers to organize information about these areas and monitor changes over time. GIS can also help track important features such as wildlife habitats, vegetation, water resources, and areas that may be affected by human activity. This information can help conservationists make better decisions about protecting natural areas, managing resources, and monitoring the health of ecosystems.

“ArcGIS Solutions: Industry-Specific GIS Configurations.” Arcgis.Com, www.arcgis.com/apps/solutions/protected-area-management. Accessed 17 Oct. 2026.